Experiments
Experiments are where you create and configure modelling workflows in Studio. An experiment defines the dataset or datasets to use, the experiment type, the target variable, the predictor columns, the forecast horizon, and the settings used to build the model.
After an experiment has been created and run, its results are made available for review. The results page helps you understand how the model performed, review the outputs, and decide whether to iterate on the experiment or use the results in a wider workflow.
Experiments Table Overview
The Experiments table provides a central view of the experiments in your workspace. From this table, you can review experiment status, organise experiments into groups, sort experiments by key attributes, and open completed experiments to review their results.
Grouped vs. Ungrouped
By default, experiments are shown in Grouped mode. This lets you organise related experiments into categories. You can switch to Ungrouped view to see all experiments in a single list, regardless of their group.
Sorting Experiments
Use the Sort By dropdown to organise experiments by status.
Experiment Statuses
Studio uses badges to indicate the current state of each experiment. The possible statuses are:
Completed - The experiment has successfully finished. The model was built without errors, and all results are now available for review.
Failed - An error occurred during the experiment process. The model was not built, and results are unavailable.
In Progress - The experiment is currently running. Model training and evaluation are actively underway.
Queued - The experiment request has been submitted and is waiting in the queue. It will begin automatically once resources are available.
Experiment actions
Completed experiments include action buttons that let you open results, iterate on the experiment, delete the experiment, or use the experiment in a wider workflow.
For eligible forecasting and anomaly detection experiments, Studio also provides a Take to Pipeline action. This lets you use a completed Studio experiment as the starting point for a scheduled Pipeline deployment.
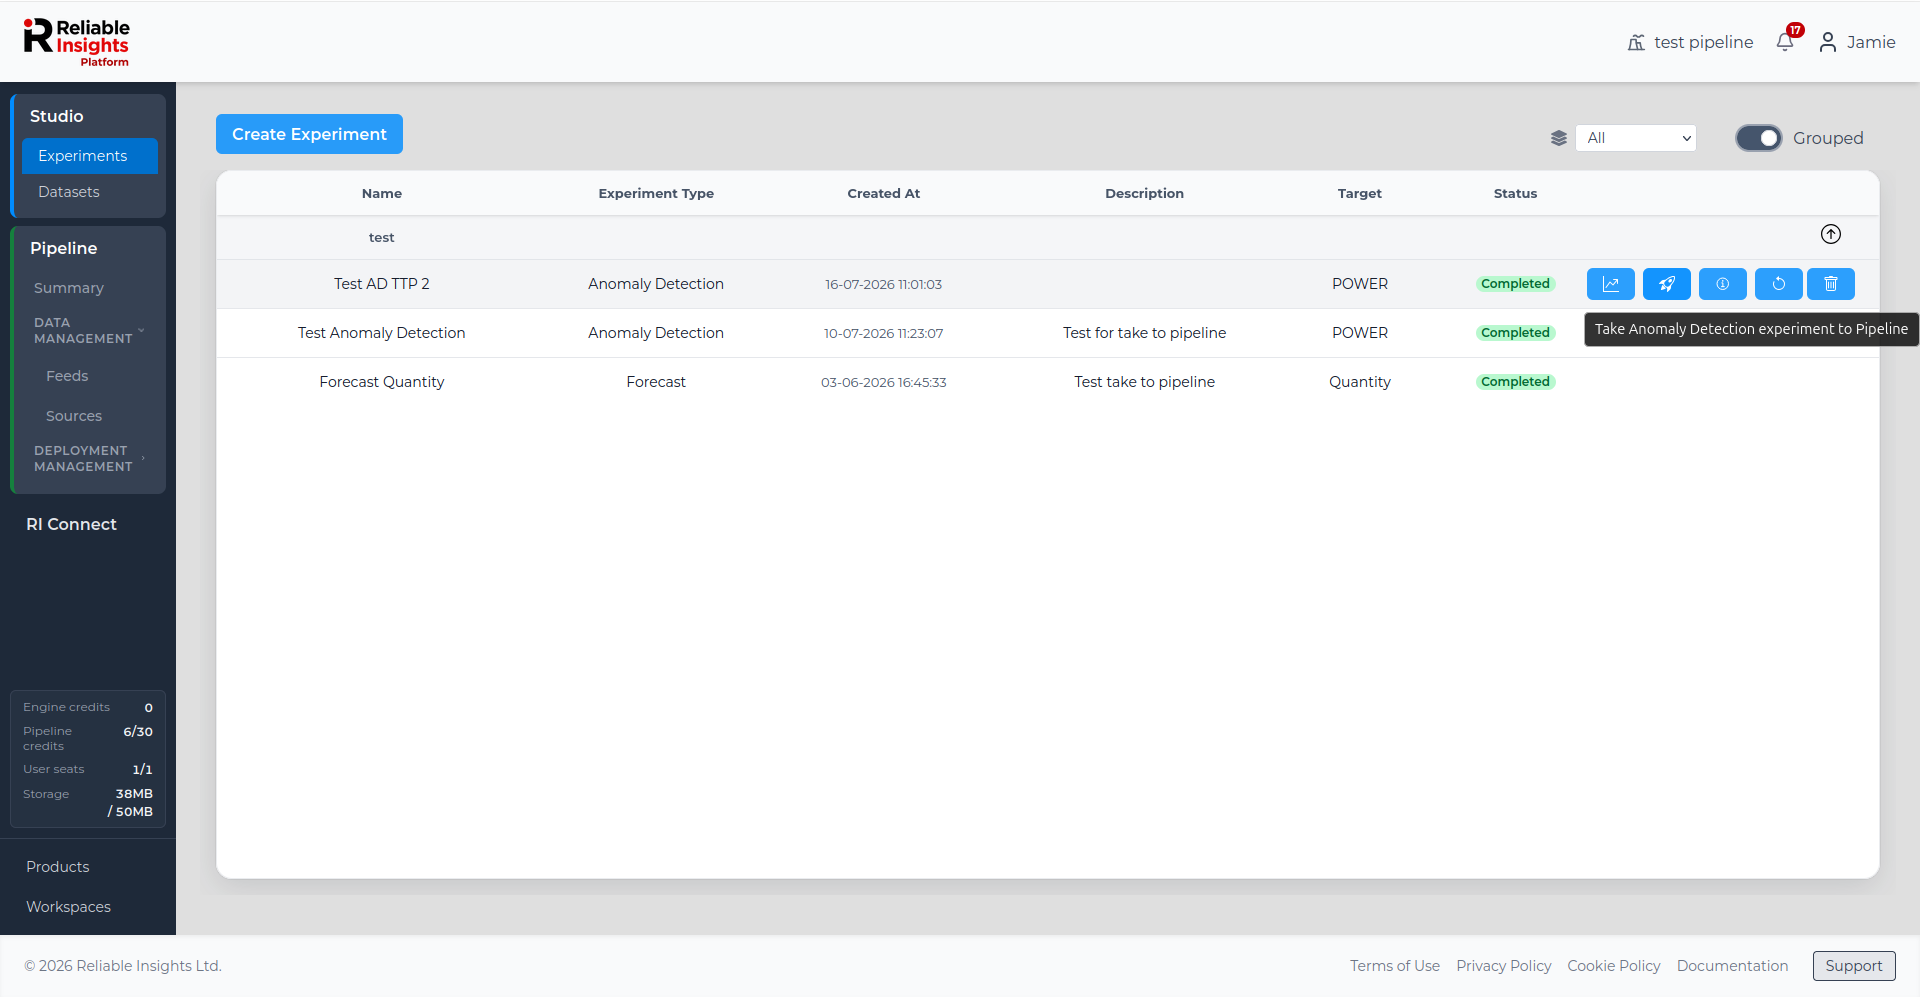
Use Take to Pipeline when you have reviewed an experiment's results and want to operationalise it as a recurring Pipeline deployment.
Creating an Experiment
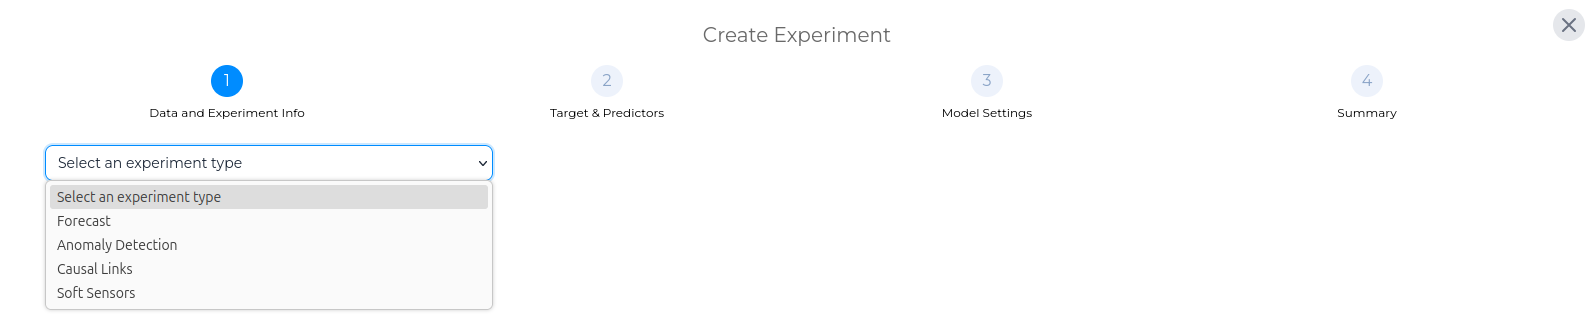
To create a new experiment, open the Experiments page and select Create Experiment. This opens the Create Experiment popup.
Creating an experiment is split into four steps:
- Selecting a Dataset and Experiment Type
- Selecting Target and Predictors
- Configuring the Model Settings
- Summary of Experiment
Selecting an Experiment Type
First, select what type of experiment you would like this to be. Studio offers four experiment types: Forecast, Anomaly Detection, Causal Links, and Soft Sensors.
Forecast
Forecast uses models to predict future behaviour across a wide range of operational variables. By analysing patterns in your historical data, the platform builds predictive models that give an understanding of what is likely to happen next.
Anomaly Detection
Anomaly detection analyses a dataset to identify behaviour that deviates from established normal patterns. Deviations are assessed in the context of influencing variables so that genuine anomalies are distinguished from expected variation.
Causal Links
Causal Links experiments help identify which variables are most associated with a selected target. They are useful when you want to understand the factors that may be influencing a change, event, or pattern in a particular target.
Soft Sensors
Soft sensors are virtual measurements, derived via estimates of values that may not be directly or reliably measured from physical instrumentation, providing a continuous and complete view of a system's state. Soft sensors enable simulation and what-if analysis allowing you to test the impact of potential intervention before committing to the physical action.
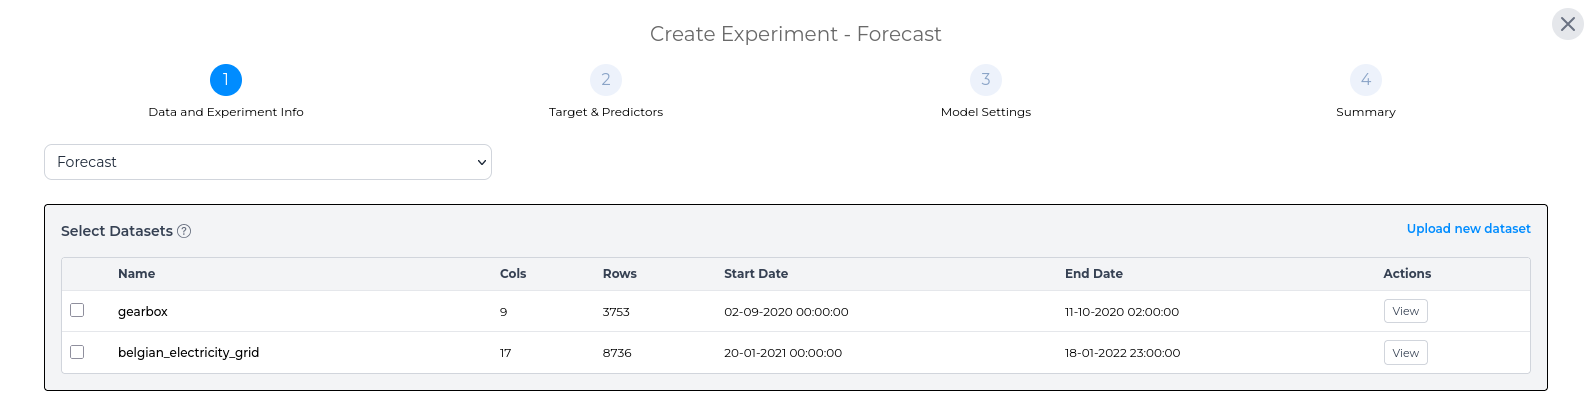
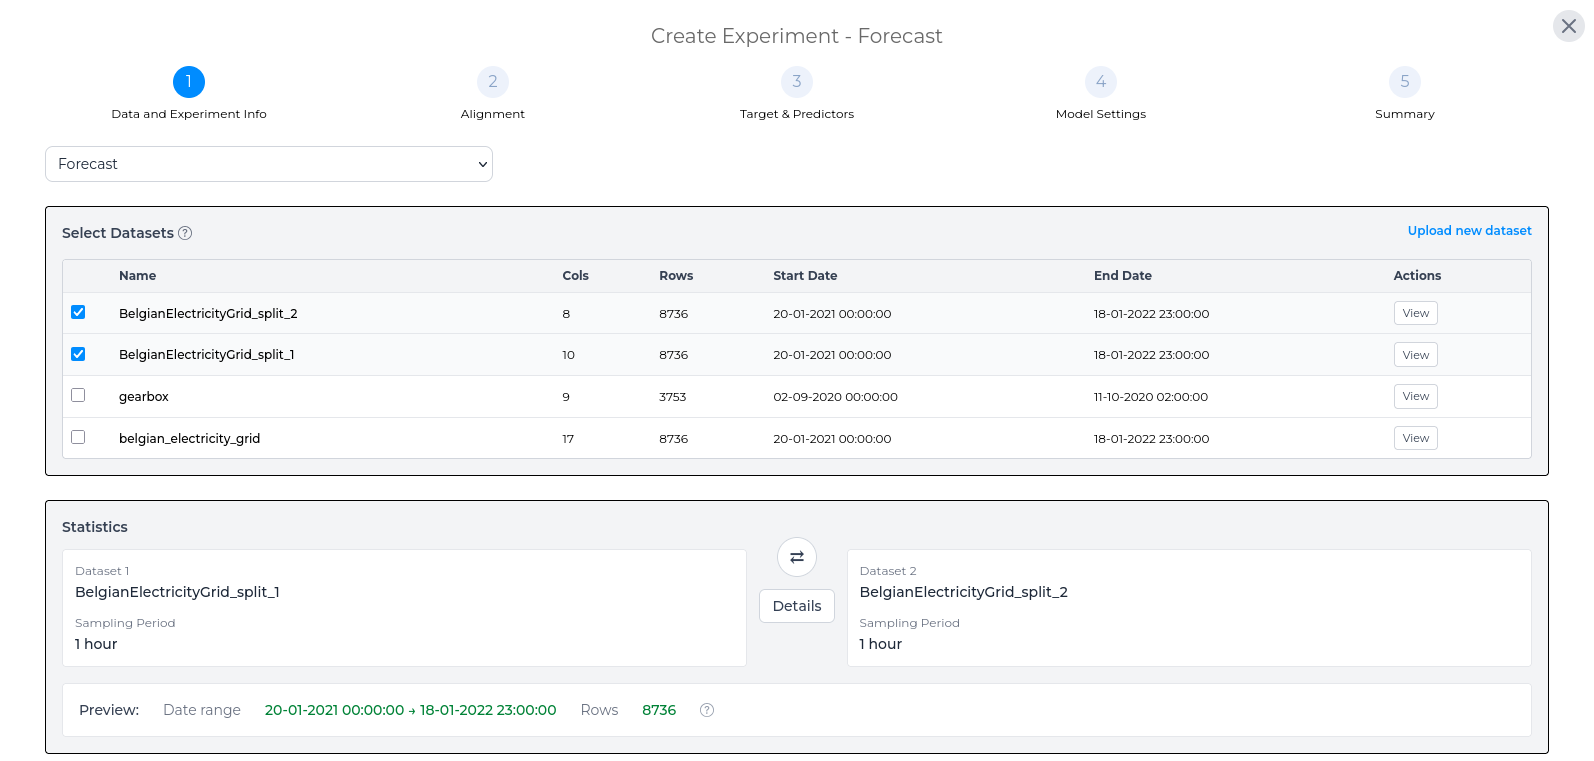
Selecting a Dataset
Once you have selected your experiment type, you then have to select the dataset(s) that you would like to use for this experiment. Any existing datasets are shown in the table, but you can add a new dataset through the Upload new dataset link. For each dataset, its name, number of rows and columns, start and end dates are listed so that you can visually select similar datasets. You can also generate a quick visualisation of each dataset via the View button.
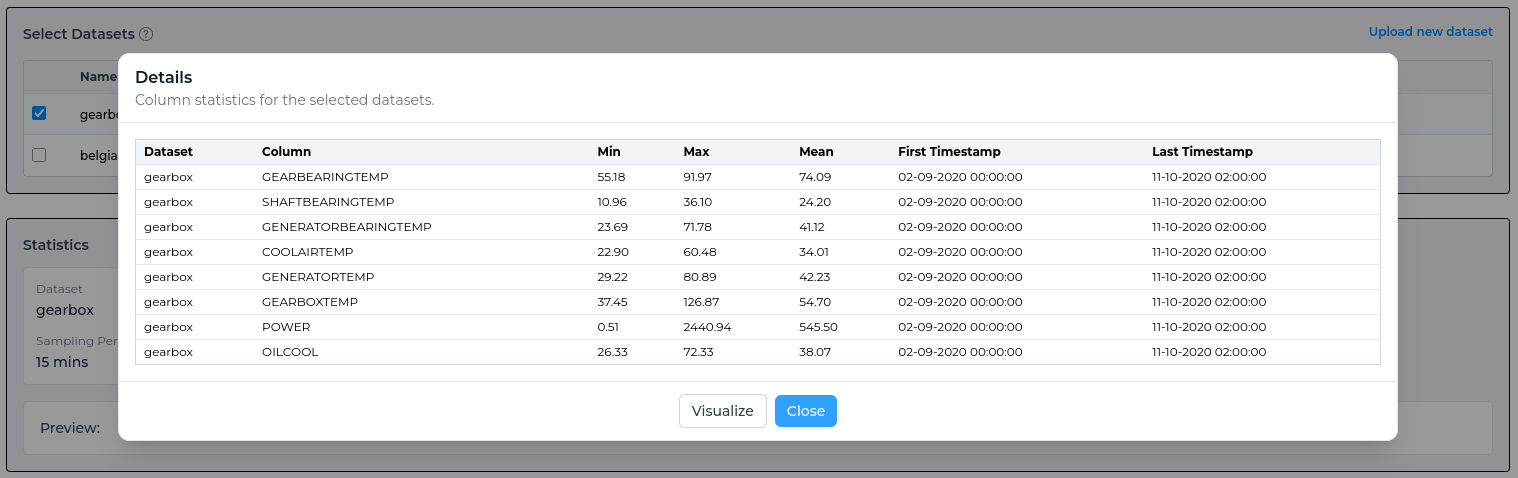
Once you have selected the dataset(s) for the experiment, the statistics panel provides an overview of the experiment dataset. For a more in-depth view of the statistics for the dataset, use the Details button on this page.
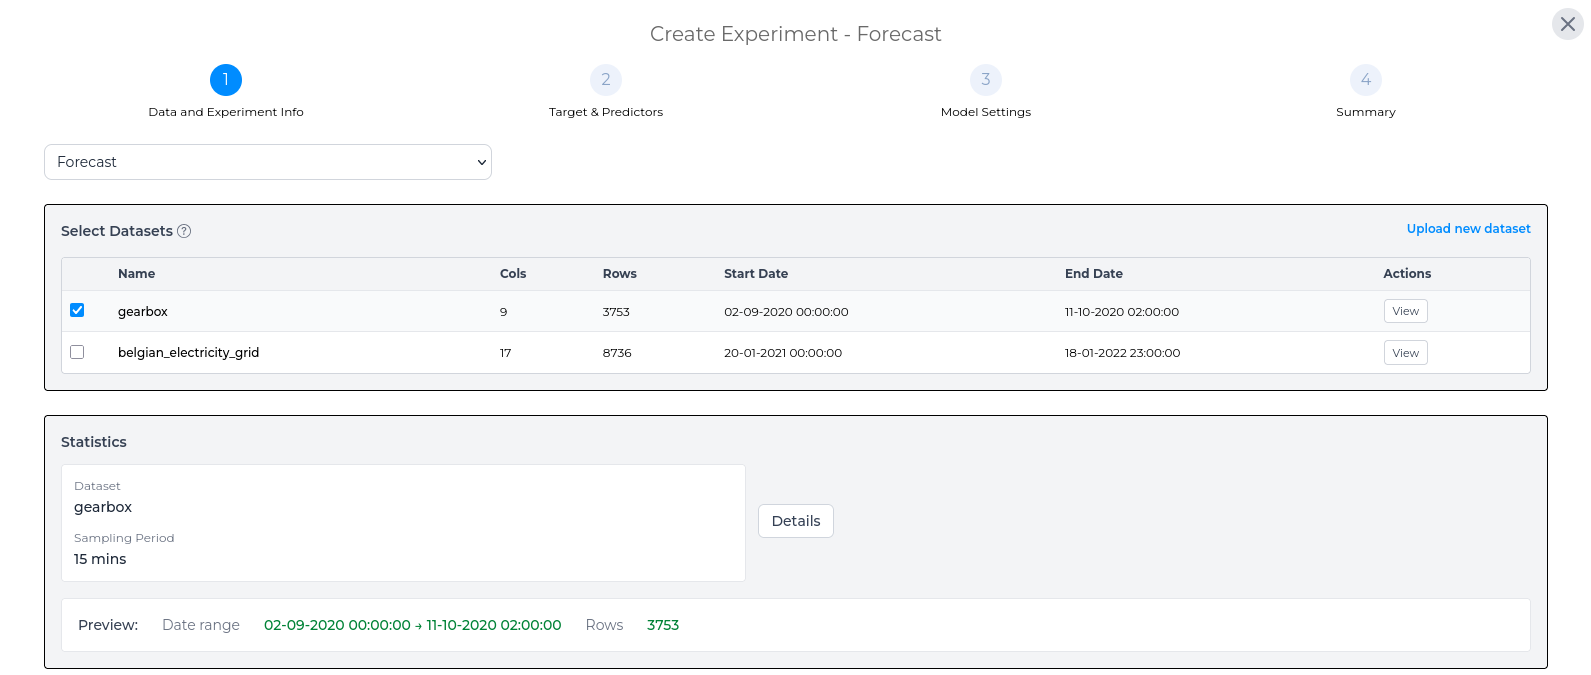
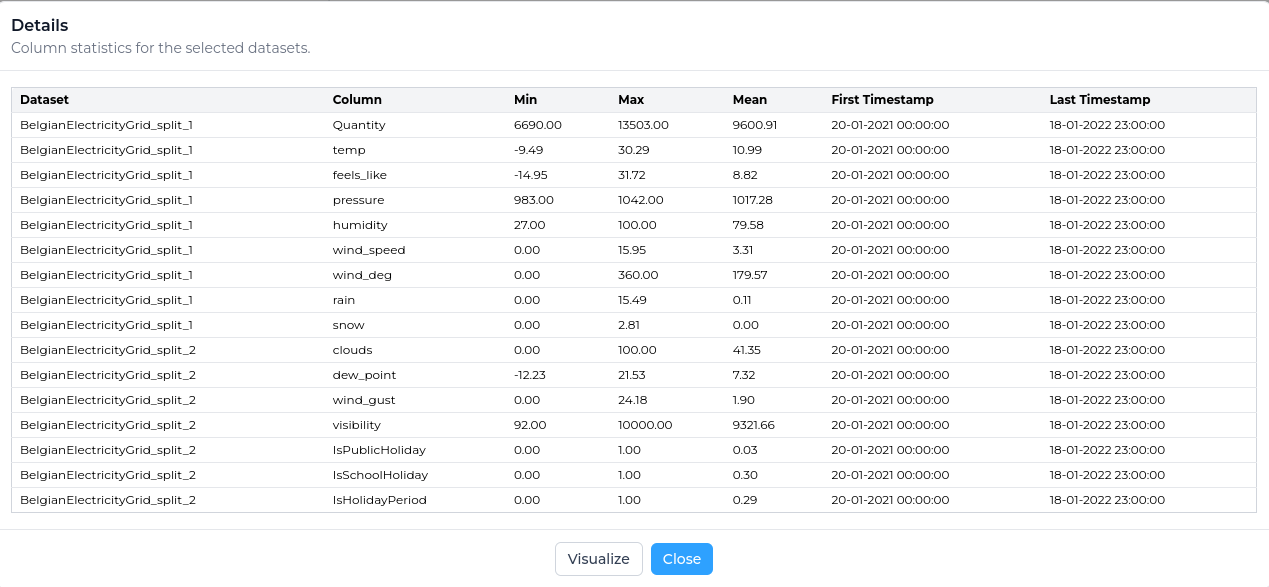
In the detailed statistics section you can see more in-depth information around the selected dataset, such as the min, max and mean for each column within the dataset.
Creating an Experiment with multiple Datasets
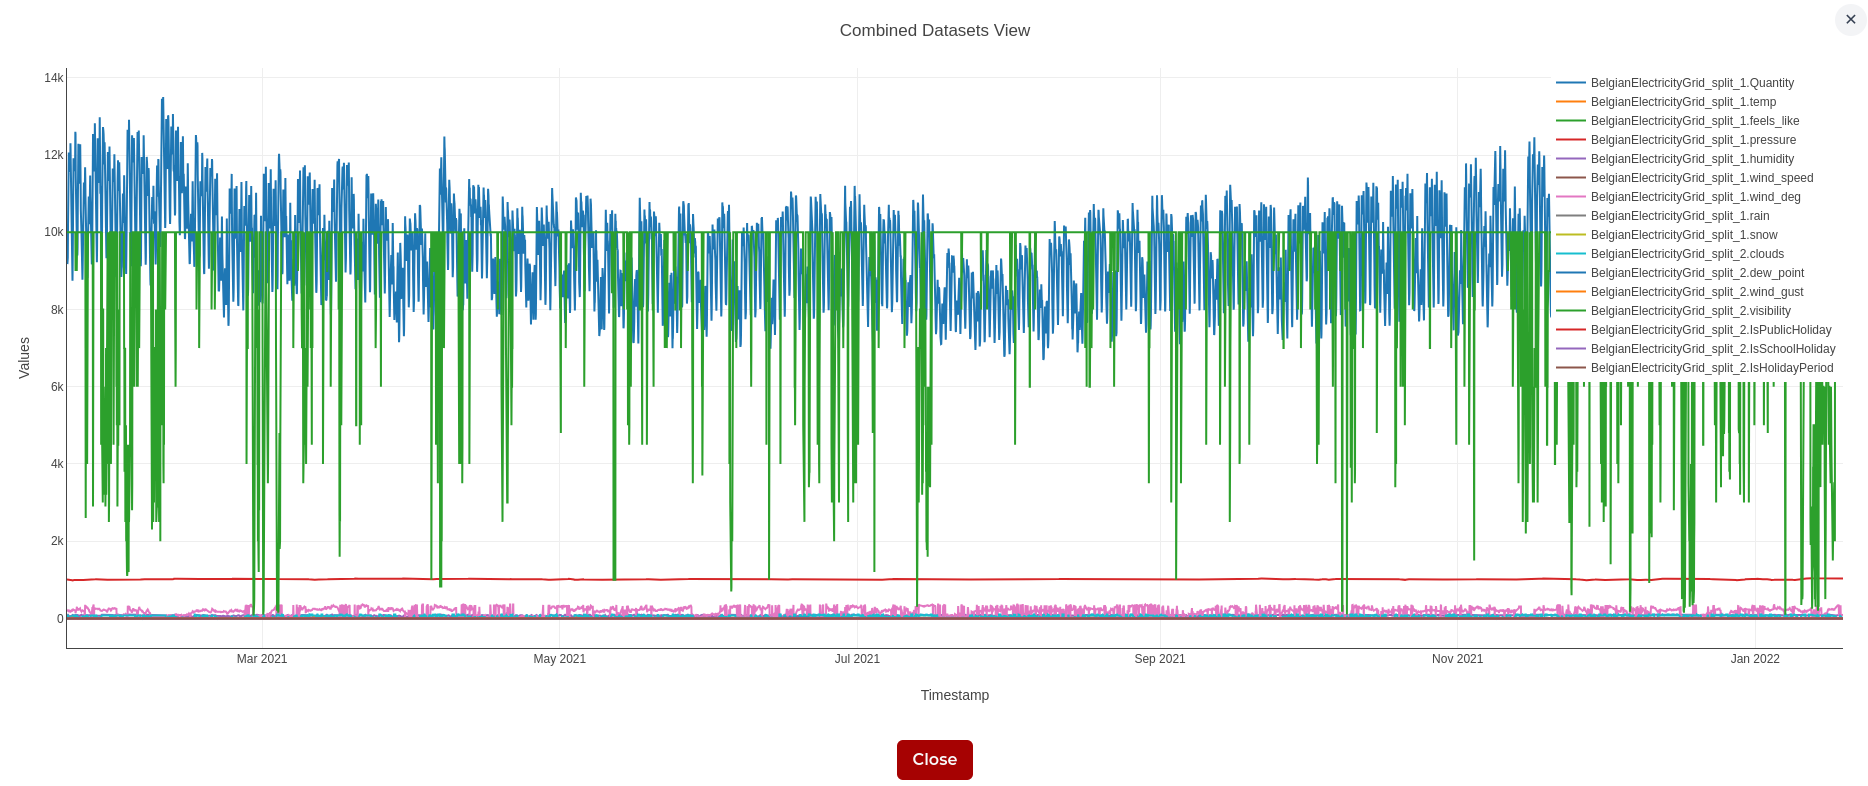
You can create an experiment with two datasets by selecting both datasets from the Select Datasets list. The preview in the statistics area will update to show the combined data range, and the row count will represent the number of timestamps shared by both selected datasets.
To view the two selected datasets together, use the Visualize button in the detailed statistics page.
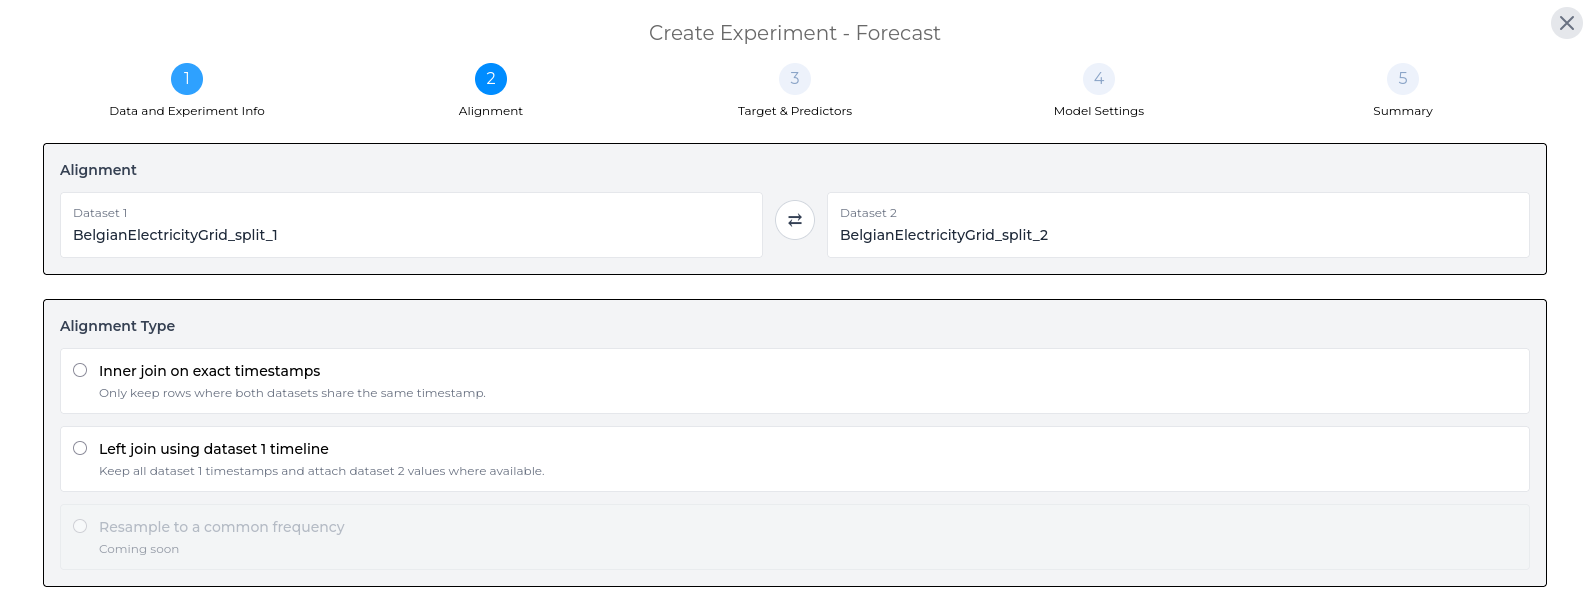
Alignment
After selecting two datasets, choose how Studio should align them before creating the experiment. Alignment determines which timestamps are kept and how values from the two datasets are combined.
There are two alignment options:
- Inner join on exact timestamps - Keeps only the timestamps that appear in both datasets.
- Left join using dataset 1 timeline - Keeps every timestamp from Dataset 1 and adds values from Dataset 2 where matching timestamps are available.
Example alignment
The example below shows two datasets with overlapping, but not identical, timestamps.
Inner join on exact timestamps
Use Inner join on exact timestamps when you only want to keep rows where both datasets have a value at exactly the same timestamp.
In the example below, only 10:00 and 10:30 are kept because they are the only timestamps present in both datasets.
This option is useful when both datasets are expected to share the same timeline and you only want to model periods where data is available from both sources.
Left join using dataset 1 timeline
Use Left join using dataset 1 timeline when Dataset 1 should act as the main timeline for the experiment. Studio keeps every timestamp from Dataset 1 and adds values from Dataset 2 where an exact timestamp match is available.
In the example below, 10:15 and 10:45 are kept because they exist in Dataset 1. Dataset 2 has no matching values at those timestamps, so the Dataset 2 values are left blank.
This option is useful when Dataset 1 contains the main target timeline and Dataset 2 provides additional supporting data where available.
Selecting Target and Predictors
The second stage of creating an experiment is where you choose what Studio should model.
First, select the target column. This is the value you want the experiment to predict, detect anomalies, or analyse. The remaining columns can then be used as predictors, which provide supporting information for the model.
In this step, you can:
- Select the target column.
- Choose which predictor columns to include.
- Review the data horizon for each predictor.
- Set the forecast horizon.
- Define the training and validation ranges.
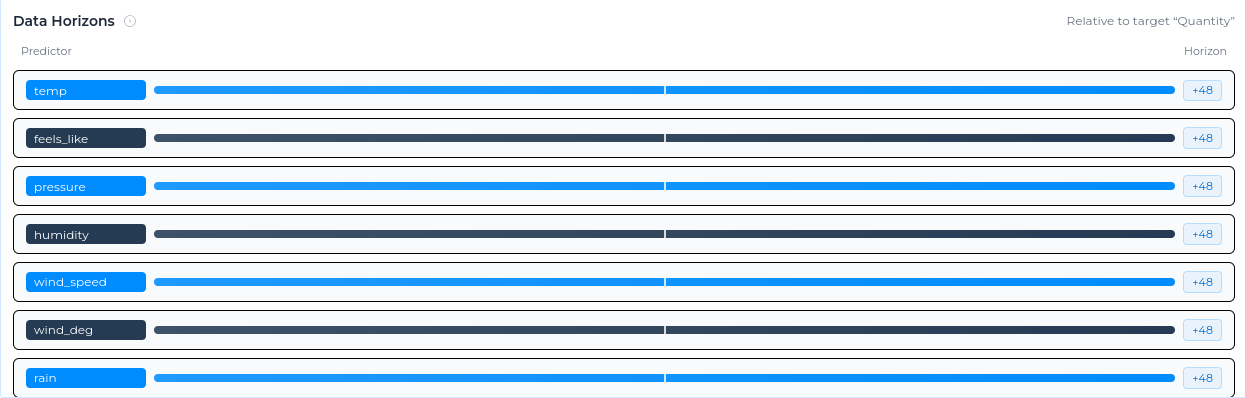
Data horizons
Data horizons show how far each predictor extends relative to the target column.
A value of 0 means the predictor and target end at the same point in time. A positive value means the predictor has more recent data than the target. A negative value means the predictor ends earlier than the target.
This helps you quickly understand which inputs have the most recent data coverage before creating the experiment. Use data horizons to check whether predictors have enough recent coverage for the forecast task. A predictor that ends too early may be less useful for a live forecast, even if it was useful historically.
Forecast horizon
Alongside selecting the target and predictors, you also choose the forecast horizon.
The forecast horizon defines how far into the future Studio should generate predictions. For example, you might forecast the next 30 minutes, 24 hours, or 7 days.
Studio supports five forecast horizon units:
- Sample - Forecast by number of data points (e.g., predict the next 10 samples)
- Minute - Forecast by minutes into the future (e.g., predict the next 30 minutes)
- Hour - Forecast by hours into the future (e.g., predict the next 24 hours)
- Day - Forecast by days into the future (e.g., predict the next 7 days)
- Week - Forecast by weeks into the future (e.g., predict the next 4 weeks)
Training and validation ranges
Time-series models need to be trained and tested using data in the correct time order.
The training range is typically the earlier part of the dataset. Studio uses this data to learn patterns, trends, and relationships between the target and predictor columns.
The validation range is typically the later part of the dataset. Studio uses this data to test how well the model performs on more recent values that were not used during training.
This split helps Studio evaluate the model in a realistic way. It also helps prevent data leakage, where future information is accidentally used during training.
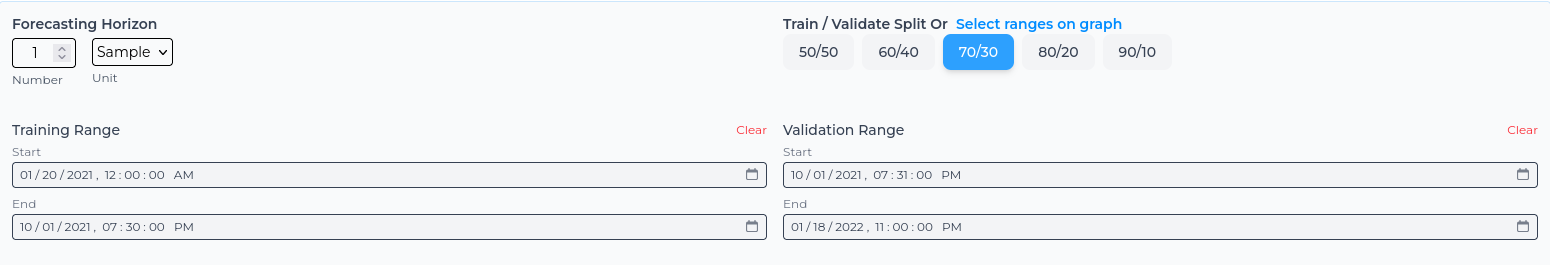
Choosing the training and validation split
Studio provides three ways to define the training and validation ranges:
- Manual dates - Set the exact start and end dates for the training and validation ranges.
- Ratio buttons - Choose a predefined split, such as 70/30, to quickly divide the dataset.
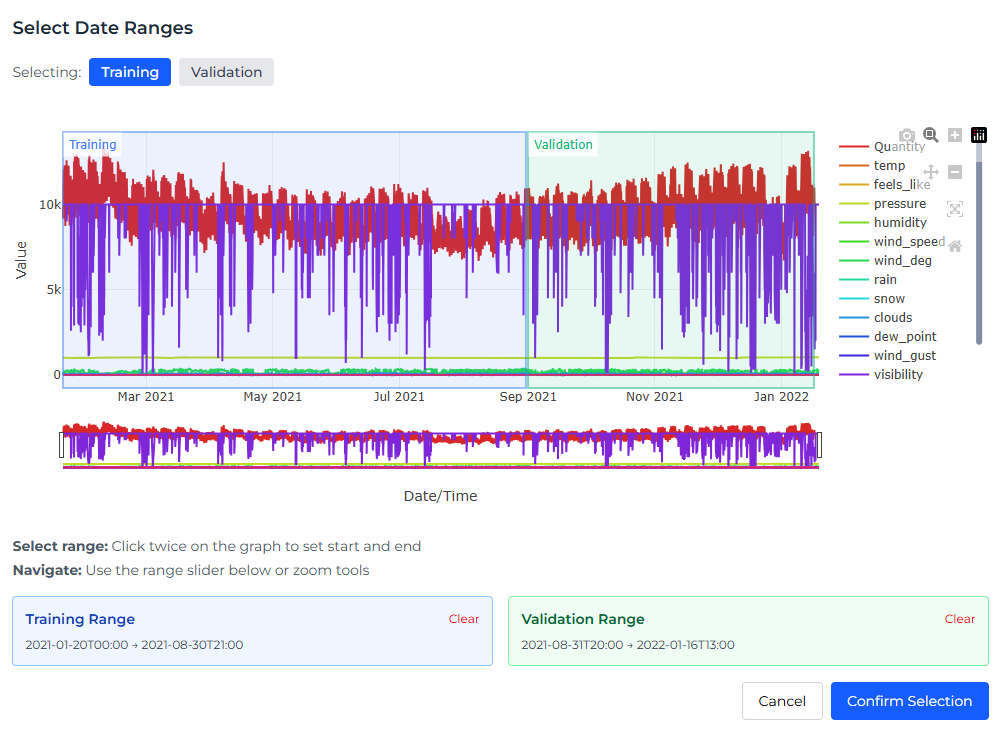
- Select on Graph - Choose the ranges visually by selecting points on the time-series graph.
When using Select on Graph, you can click directly on the graph to define the start and end points for each range. The Range Slider below the graph lets you zoom in and adjust the visible date range.
Defining the Model Settings
Experiment Settings
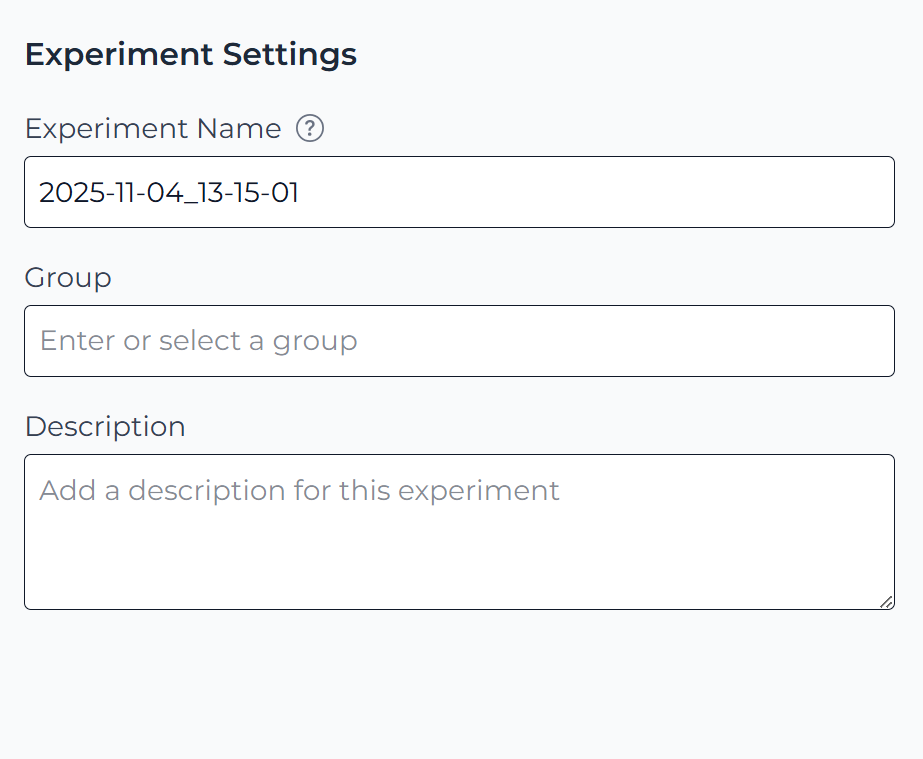
After selecting the target and predictors, configure the main details for the experiment.
Every experiment needs a name. You can also add it to a group and provide a description. Groups help organise related experiments, while descriptions make it easier for you and your team to understand the purpose of each experiment later.
Experiments without a group appear under Ungrouped in the Grouped view of the Experiments page.
Math Settings
Math settings control how Studio uses your data to build the model.
Studio automatically selects suitable default settings, so most users can continue without changing them. Advanced users can adjust these settings to control model behaviour, or test different modelling approaches.
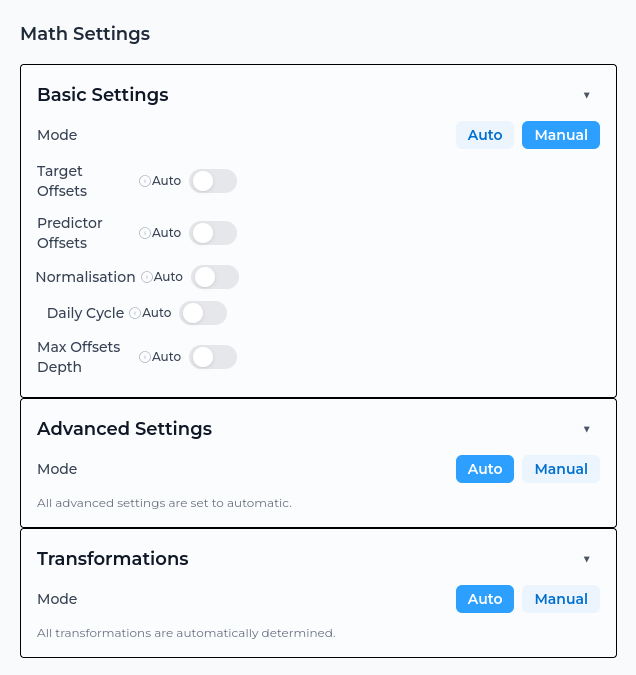
The settings are grouped into three sections:
-
Basic - Fundamental options such as target and predictor offsets, data normalisation, and daily cycle settings.
-
Advanced - Options for controlling model complexity, feature depth, historical offsets, and prediction confidence intervals.
-
Transformations - Options that convert raw data into model features, such as moving averages, Fourier components, and categorical encodings.
Most users should use the automatic defaults unless they have a specific modelling reason to change them.
Basic Settings
Basic settings define how the model uses the target, predictors, historical values, and recurring patterns. These settings help Studio structure the prediction task and understand the time-series behaviour in the dataset.
Advanced Settings
Advanced settings provide more control over how the model is built. They can be used to adjust model complexity, uncertainty estimation, feature selection, and how much historical data is considered.
These settings are intended for users who want more control over the modelling process.
Transformations
Transformations change or encode the input data so that patterns are easier for the model to learn. They can help capture trends, seasonality, cycles, and other recurring behaviour.
Available transformations include:
- Exponential Moving Average
- Simple Moving Average
- Trend
- Polynomial
- Piecewise Linear
- Day of Week
- Rest of Week
- Month
- Fourier
- Periodic
- Intercept
- Identity
Summary of Experiment
The final step shows a summary of the experiment configuration. Review the selected dataset, target, predictors, forecast horizon, and model settings.
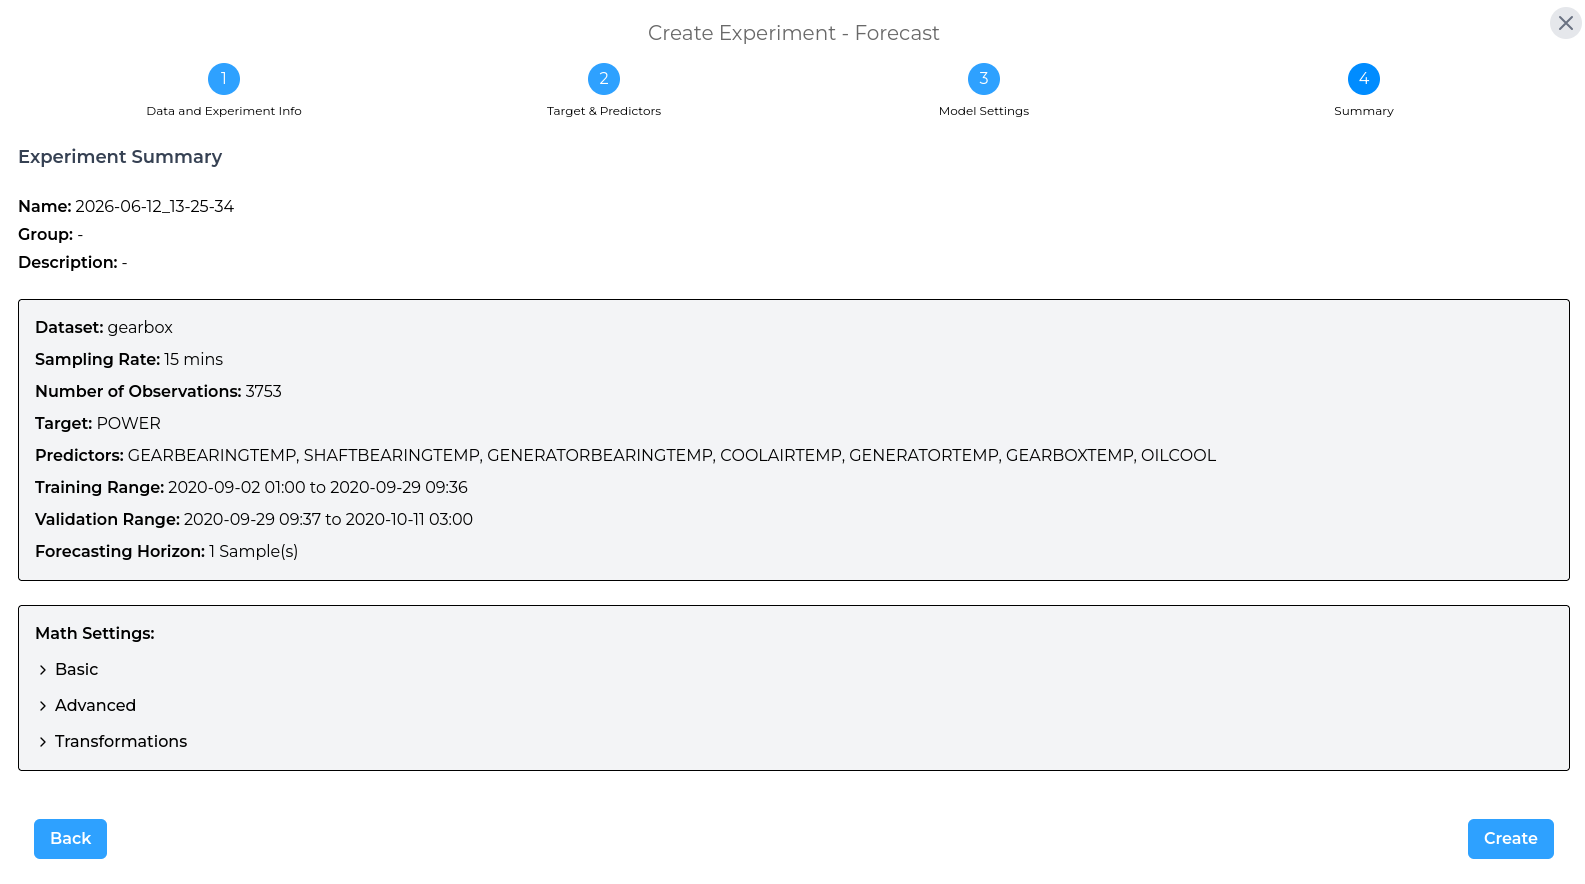
Once everything is correct, select Create to run the experiment.
Iterating on an Experiment
After reviewing the results of a completed experiment, you may want to make changes and run it again. This is called iterating on an experiment.
Iteration is useful because Studio starts from the existing experiment configuration. The selected dataset, target, predictors, forecast horizon, training and validation ranges, and model settings are carried over from the experiment you are iterating on.
You can then adjust only the parts you want to change, such as:
- Changing the training or validation ranges.
- Including or excluding predictor columns.
- Adjusting the forecast horizon.
- Updating model settings.
- Testing a different configuration.
The iteration follows the same steps as creating a new experiment, but the original experiment is not overwritten. Instead, Studio creates a new experiment.
This allows you to compare different versions, track changes over time, and keep previous results available for reference.