Introducing Pipeline


Pipeline automates live forecasting workflows. It connects to your datasources, pulls time-series data on a schedule, creates and updates feeds, runs forecast deployments, and makes fresh results available for review.
Pipeline workflow
Pipeline is designed for operational forecasting. It helps you move from connected datasources to scheduled feeds, recurring deployments, and regularly updated results.
In a typical Pipeline workflow, you connect to a datasource, create feeds from the time-series columns you want to track, configure a deployment, and then review the results produced by scheduled deployment runs.
Pipeline is best used when a workflow needs to run repeatedly, data needs to stay up to date, and forecast results need to be reviewed over time.
What Pipeline does
Pipeline supports the full automated forecasting workflow:
-
Connects to your data - Register datasources such as SFTP, FTP via TLS, or API-based ingestion workflows.
-
Creates feeds - Store individual time-series feeds from your datasources. Feeds are the inputs used by Pipeline deployments.
-
Monitors data freshness - Track feed status, pull activity, and alerts when something needs attention.
-
Runs forecasts automatically - Create deployments that define the target, predictors, forecast horizon, training setup, and run schedule.
-
Shows results - Review backtesting results, production forecasts, model metrics, feature importance, and predictor importance for completed deployment runs.
Sections
Pipeline is organised into the following sections:
- Alerts - View notifications about datasource issues, failed pulls, unhealthy feeds, and deployment problems.
- Datasources - Add, test, edit, and delete connections to external data systems.
- Feeds - Manage the time-series feeds used by Pipeline. Add feeds from datasources, export feed data, or take feeds to Studio.
- Deployments - Create and manage recurring forecast jobs.
- Results - Review the latest completed deployment run, including forecasts, metrics, and model importance outputs.
Navigation
Pipeline is accessed from the left sidebar in the Reliable Insights Platform.
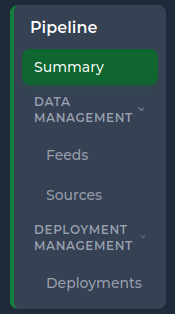
- Summary - Workspace-level health, including feed counts, deployment counts, recent activity, and performance indicators.
- Feeds - View and manage individual time-series feeds. Upload, patch, export, and send feeds to Studio.
- Sources - Add, edit, test, and delete datasource connections.
- Deployments - Create and manage recurring forecast deployments. Open results for completed runs.