Deployments
A deployment is a recurring automated Pipeline job. It uses selected Pipeline feeds and a schedule you define to run either a forecasting workflow or an anomaly detection workflow.
Deployments can be used for:
- Forecasting - Generate future predictions for a selected target feed.
- Anomaly Detection - Check a selected KPI for unusual behaviour using one or more explanatory variables.
Each deployment represents a live workflow for a specific target or KPI. When a deployment runs, Pipeline fetches the latest feed data, runs the configured workflow, and stores the run results for review. Previous completed runs can also be reviewed later, making it easier to compare model behaviour and performance over time.
Deployments are managed from the Deployments page.
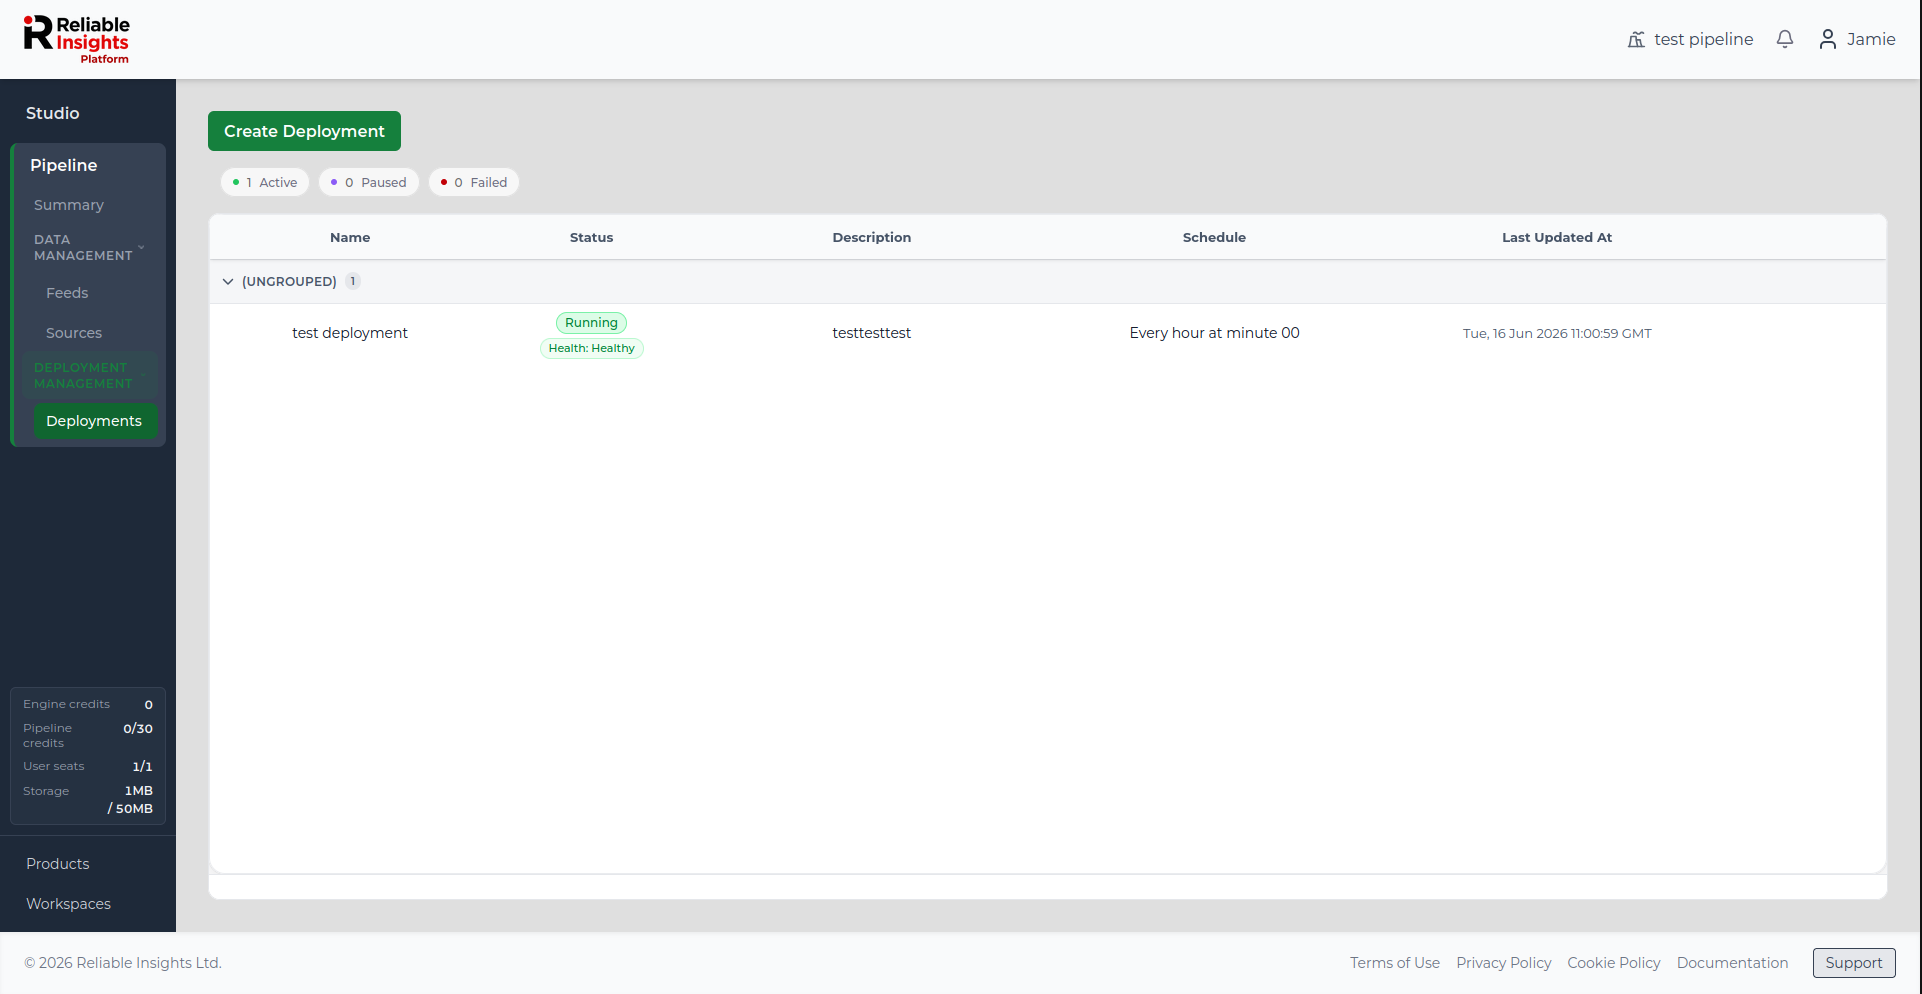
Deployment statuses
Active - The deployment is scheduled and running normally.
Running - A deployment run is in progress right now.
Paused - The deployment has been manually paused. No new runs will start until resumed.
Failed - The most recent run encountered an error. Check alerts for more information.
Inactive - The deployment has been stopped. It must be deleted and recreated to run again.
Deployment types
When creating a deployment, choose whether the deployment should be a Forecasting deployment or an Anomaly Detection deployment.
- Forecasting deployments predict future values for a selected target feed. They are useful when you want Pipeline to produce scheduled forecasts, such as expected demand, usage, production output, or sensor values.
- Anomaly Detection deployments check a selected KPI for unusual behaviour. They are useful when you want Pipeline to monitor recent data and highlight values that do not match the expected pattern.
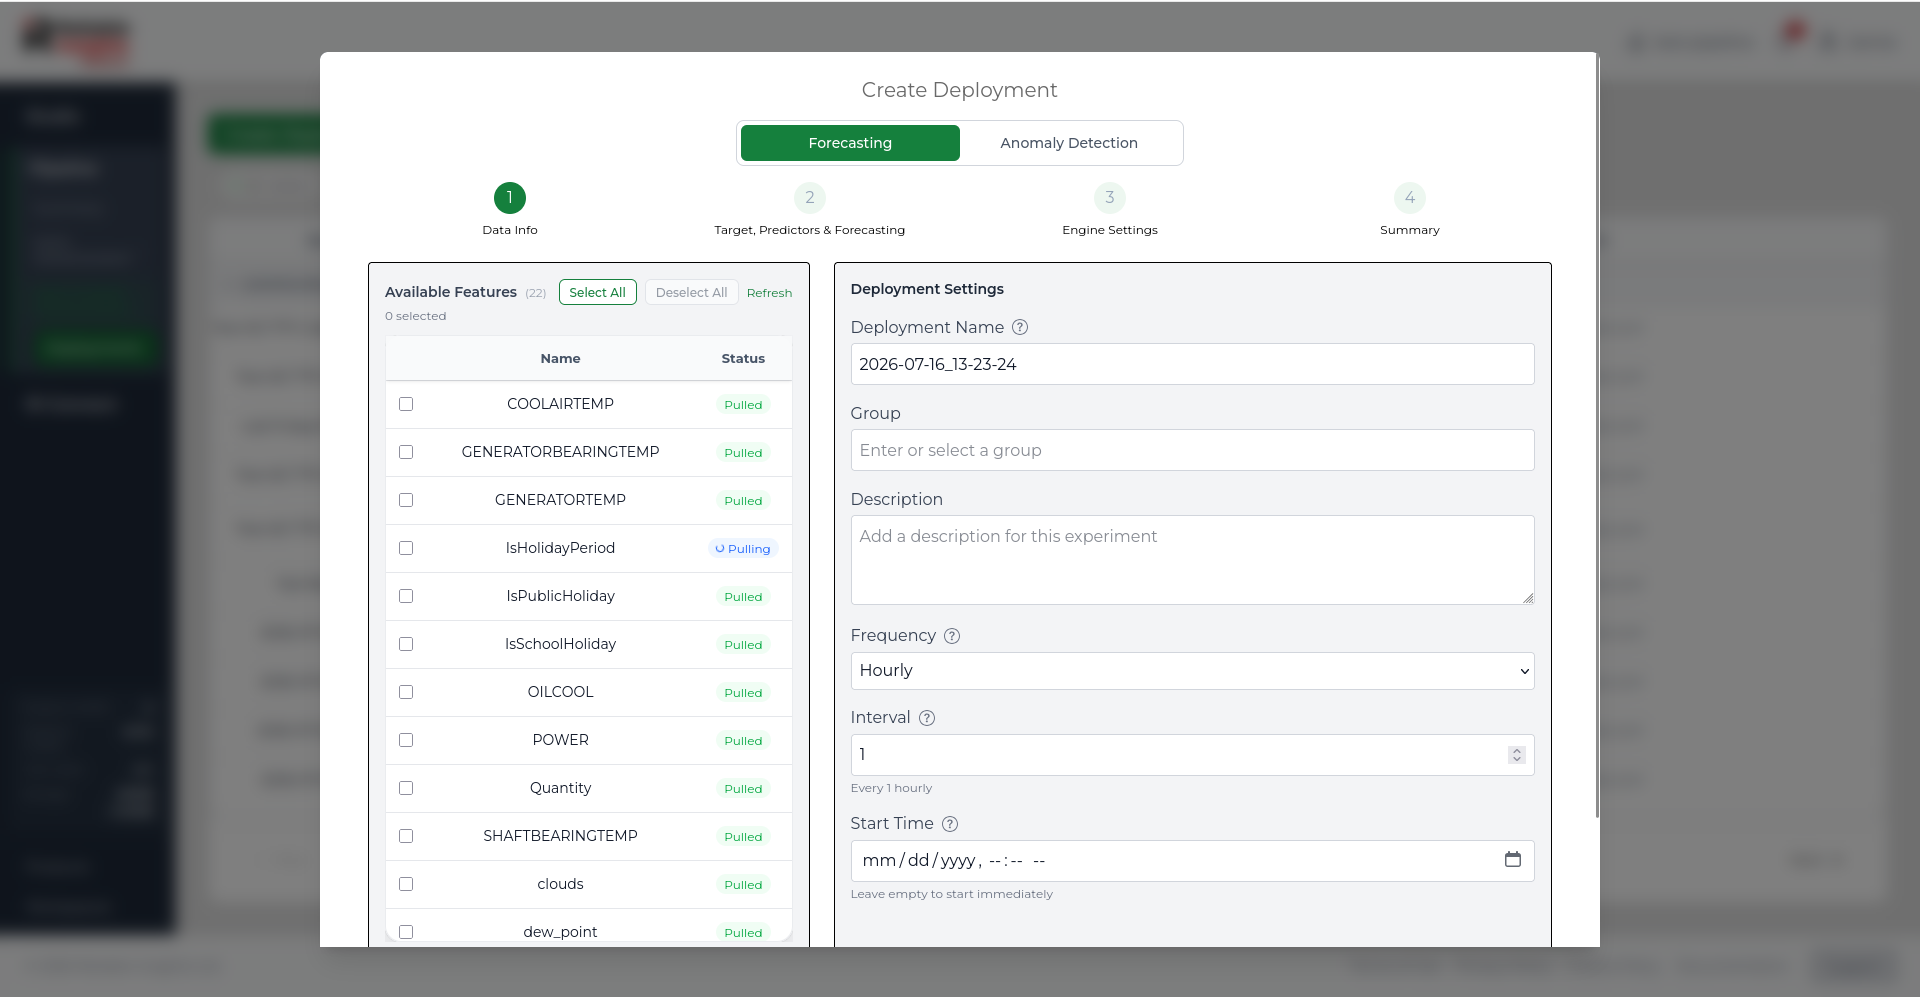
Creating a deployment
- Go to Deployments in the left sidebar.
- Click Create Deployment.
- Choose the deployment type: Forecasting or Anomaly Detection.
- Complete the setup process for the selected deployment type.
The setup flow changes depending on the deployment type. Forecasting deployments require a target, predictors, forecast horizon, and engine settings. Anomaly Detection deployments require a KPI, explanatory variables, a reference strategy, and a detection window.
Step 1 - Data Info
The first step is used to select the feeds that the deployment can use and configure basic deployment settings.
You can also assign the deployment to a Group. Groups help organise related deployments in the Deployments table.
All selected feeds become available in the next step.
For forecasting deployments, the selected feeds become available as target and predictor options. For anomaly detection deployments, the selected feeds become available as KPI and explanatory variable options.
Forecasting deployments
Forecasting deployments create scheduled forecasts for a selected target feed.
Step 2 - Target, Predictors & Forecasting
Configure what the deployment should forecast and how the forecast should be generated.
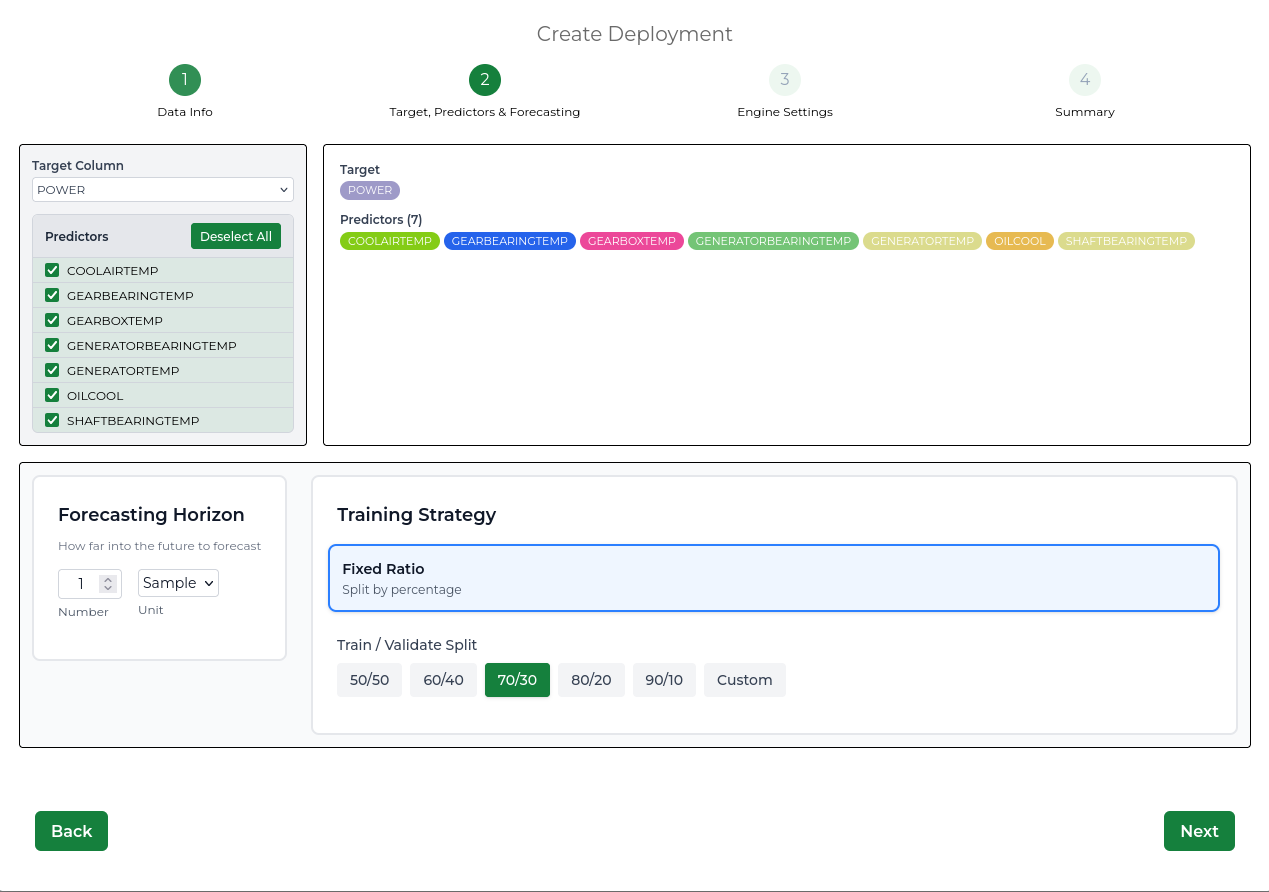
| Setting | Description |
|---|---|
| Target column | The feed you want to forecast. |
| Predictors | The feeds used as inputs to the model. |
| Forecast horizon | How far ahead the model should predict. |
| Training strategy | Defines how Pipeline splits the available history into training and validation data. |
| Train / Validate split | Choose a predefined split, such as 70/30, or enter a custom training percentage. |
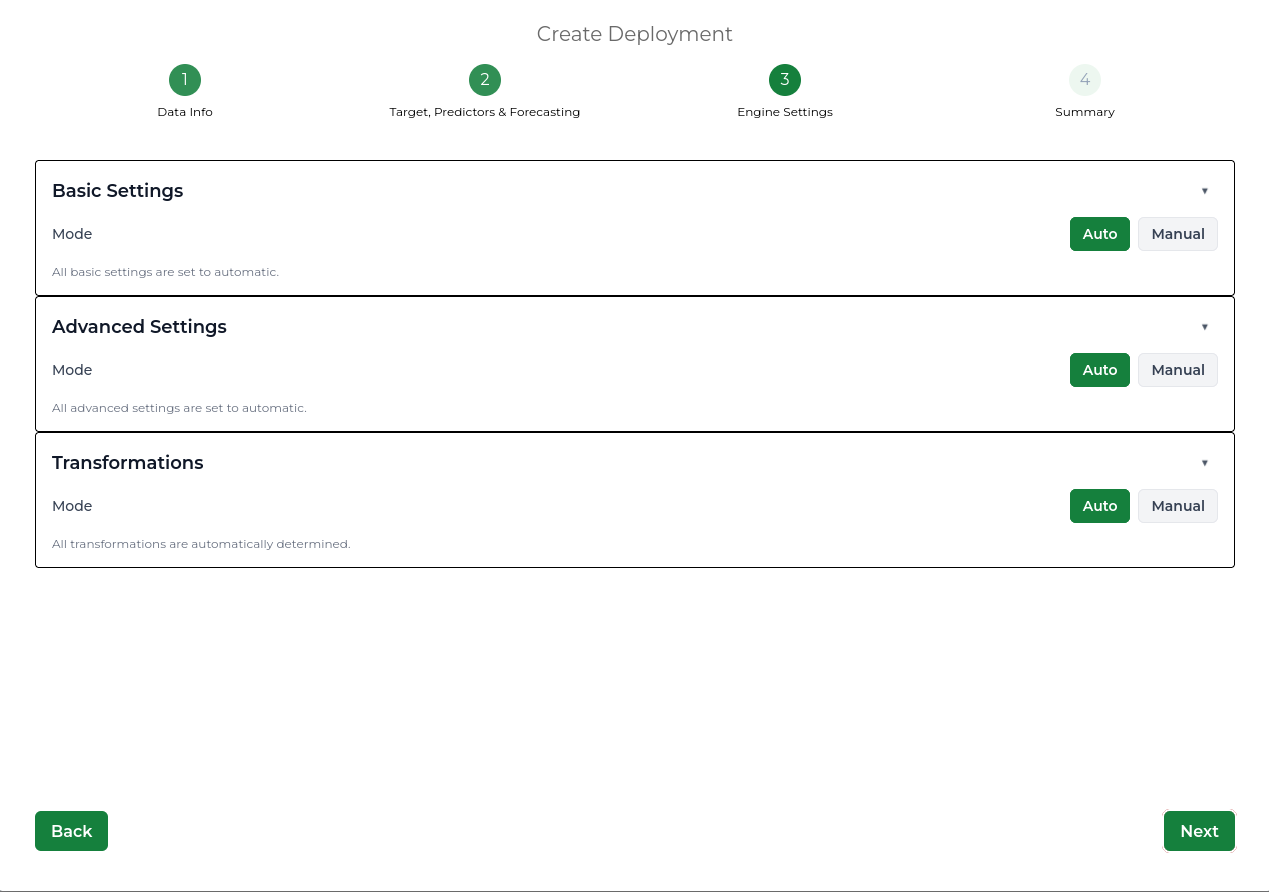
Step 3 - Engine Settings
Engine settings control how the forecasting model is built.
The default settings are suitable for most use cases. Most users do not need to change them unless they have specific modelling requirements.
| Setting | Description |
|---|---|
| Normalisation | How input data is scaled before training (auto is recommended). |
| Daily cycle | Enable if your data follows a repeating daily pattern, such as energy demand, web traffic, or production activity. |
| Confidence level | The statistical confidence interval for forecast bounds. |
| Prediction boundaries | Optional hard minimum or maximum limits on forecast output values. |
| Offsets | Advanced lag features. Leave as auto unless you have specific requirements. |
| Max feature count | Caps the number of features the model can select. |
| Transformations | Optional mathematical transforms applied to input feeds before training. |
Anomaly Detection deployments
Anomaly Detection deployments check a selected KPI for unusual behaviour. They use the selected KPI and explanatory variables to identify values that do not match the expected pattern.
Step 2 - KPI & Explanatory Variables
Choose the KPI that should be checked for anomalies, then select the explanatory variables that may help explain normal behaviour.
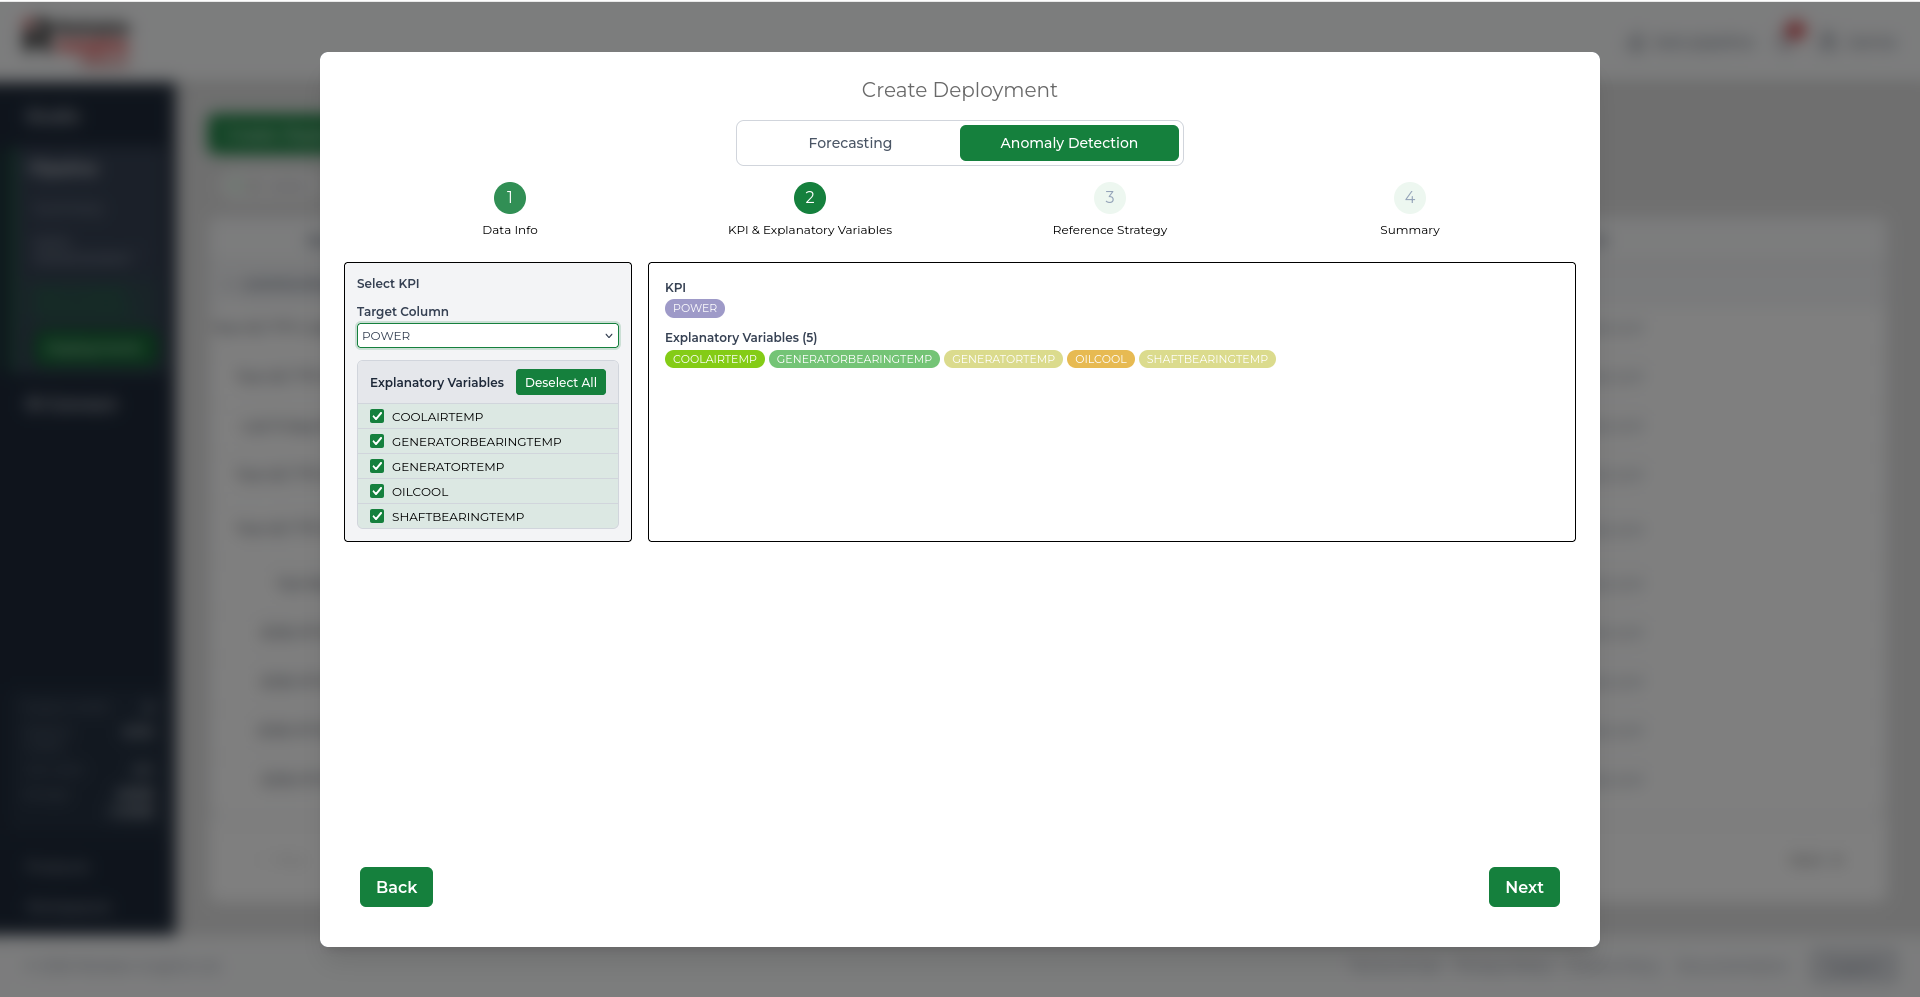
| Setting | Description |
|---|---|
| KPI | The main feed that should be checked for anomalies. |
| Explanatory variables | Supporting feeds that help the model understand expected behaviour. |
Use explanatory variables that are likely to influence the KPI. For example, if the KPI is power usage, explanatory variables might include temperature, operating conditions, or related sensor values.
Step 3 - Reference Strategy
The reference strategy controls what data the deployment uses as normal behaviour when checking for anomalies.
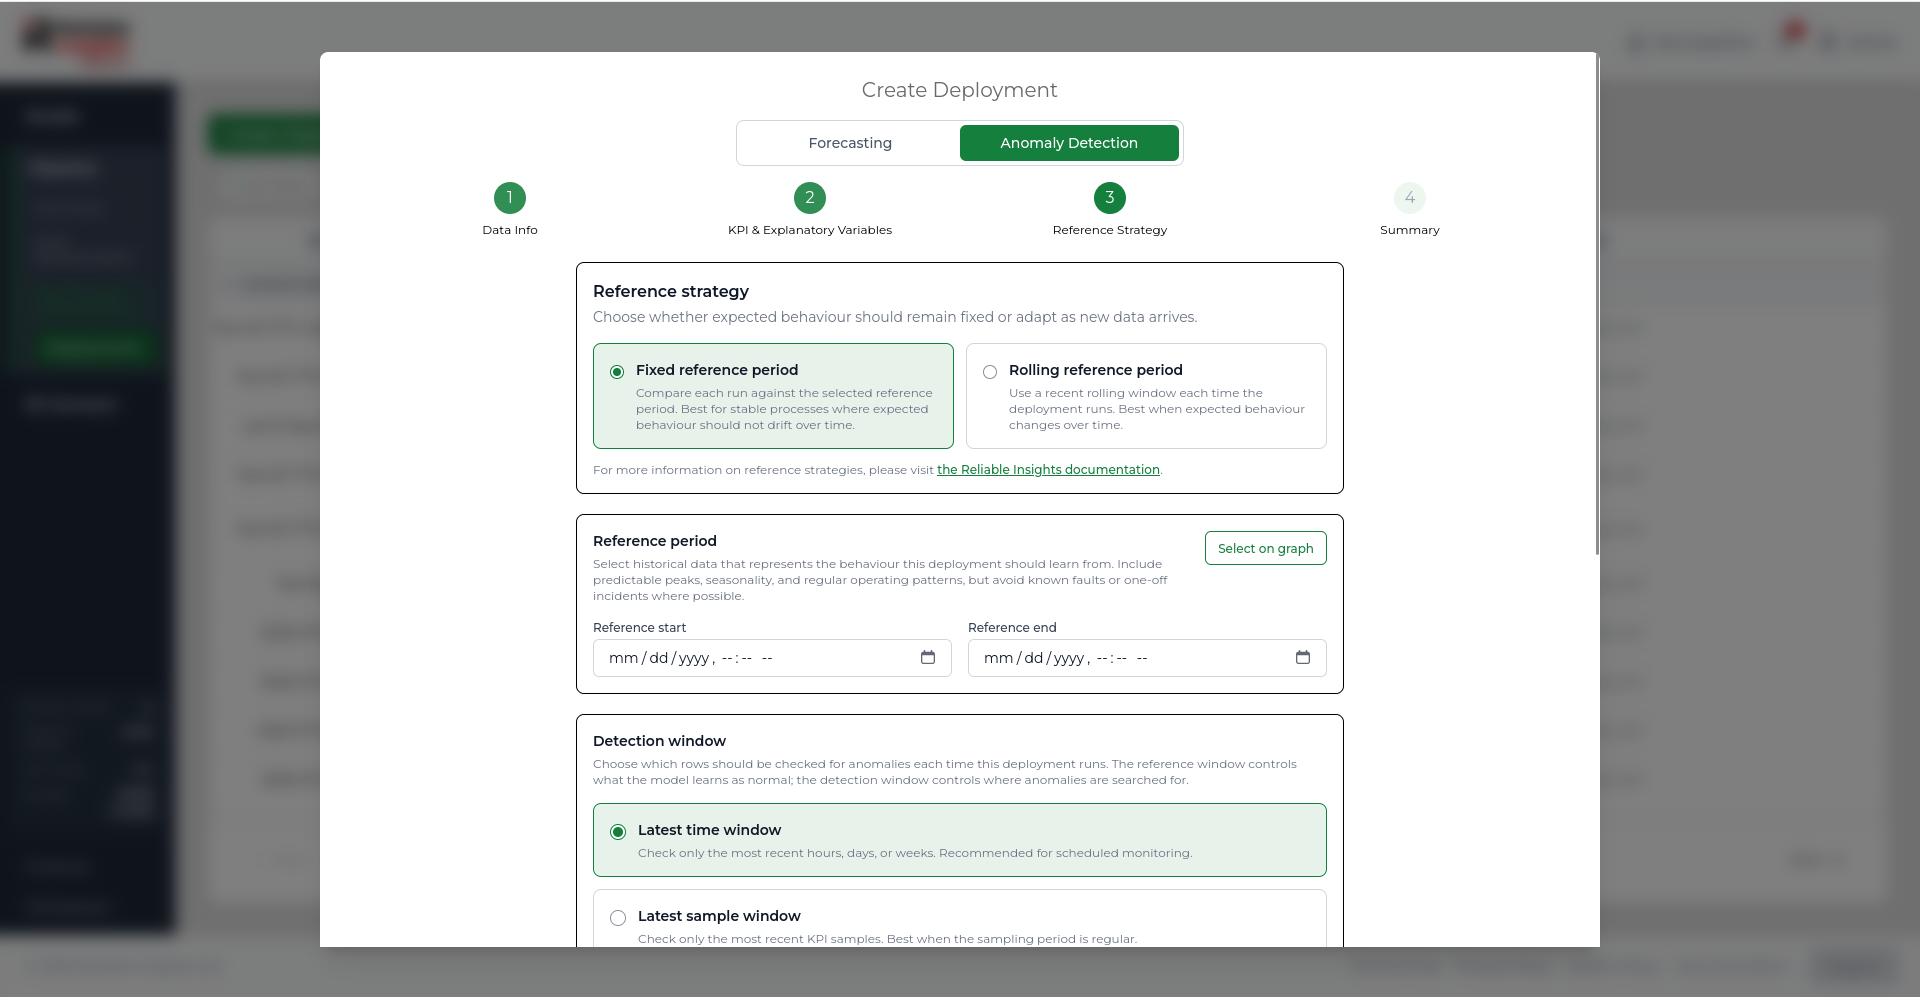
| Setting | Description |
|---|---|
| Fixed reference period | Uses a selected historical period as the reference for normal behaviour. This is best when expected behaviour should remain stable over time. |
| Rolling reference period | Uses a recent rolling window each time the deployment runs. This is best when expected behaviour changes over time. |
| Reference period | For a fixed reference strategy, the historical period that represents normal behaviour. |
| Rolling window | For a rolling reference strategy, how far back each deployment run should look when learning expected behaviour. |
A fixed reference period is useful when you have a known clean period of normal behaviour. A rolling reference period is useful when the process changes over time and the deployment should adapt as new data arrives.
Detection window
The detection window controls which KPI rows are checked for anomalies each time the deployment runs.
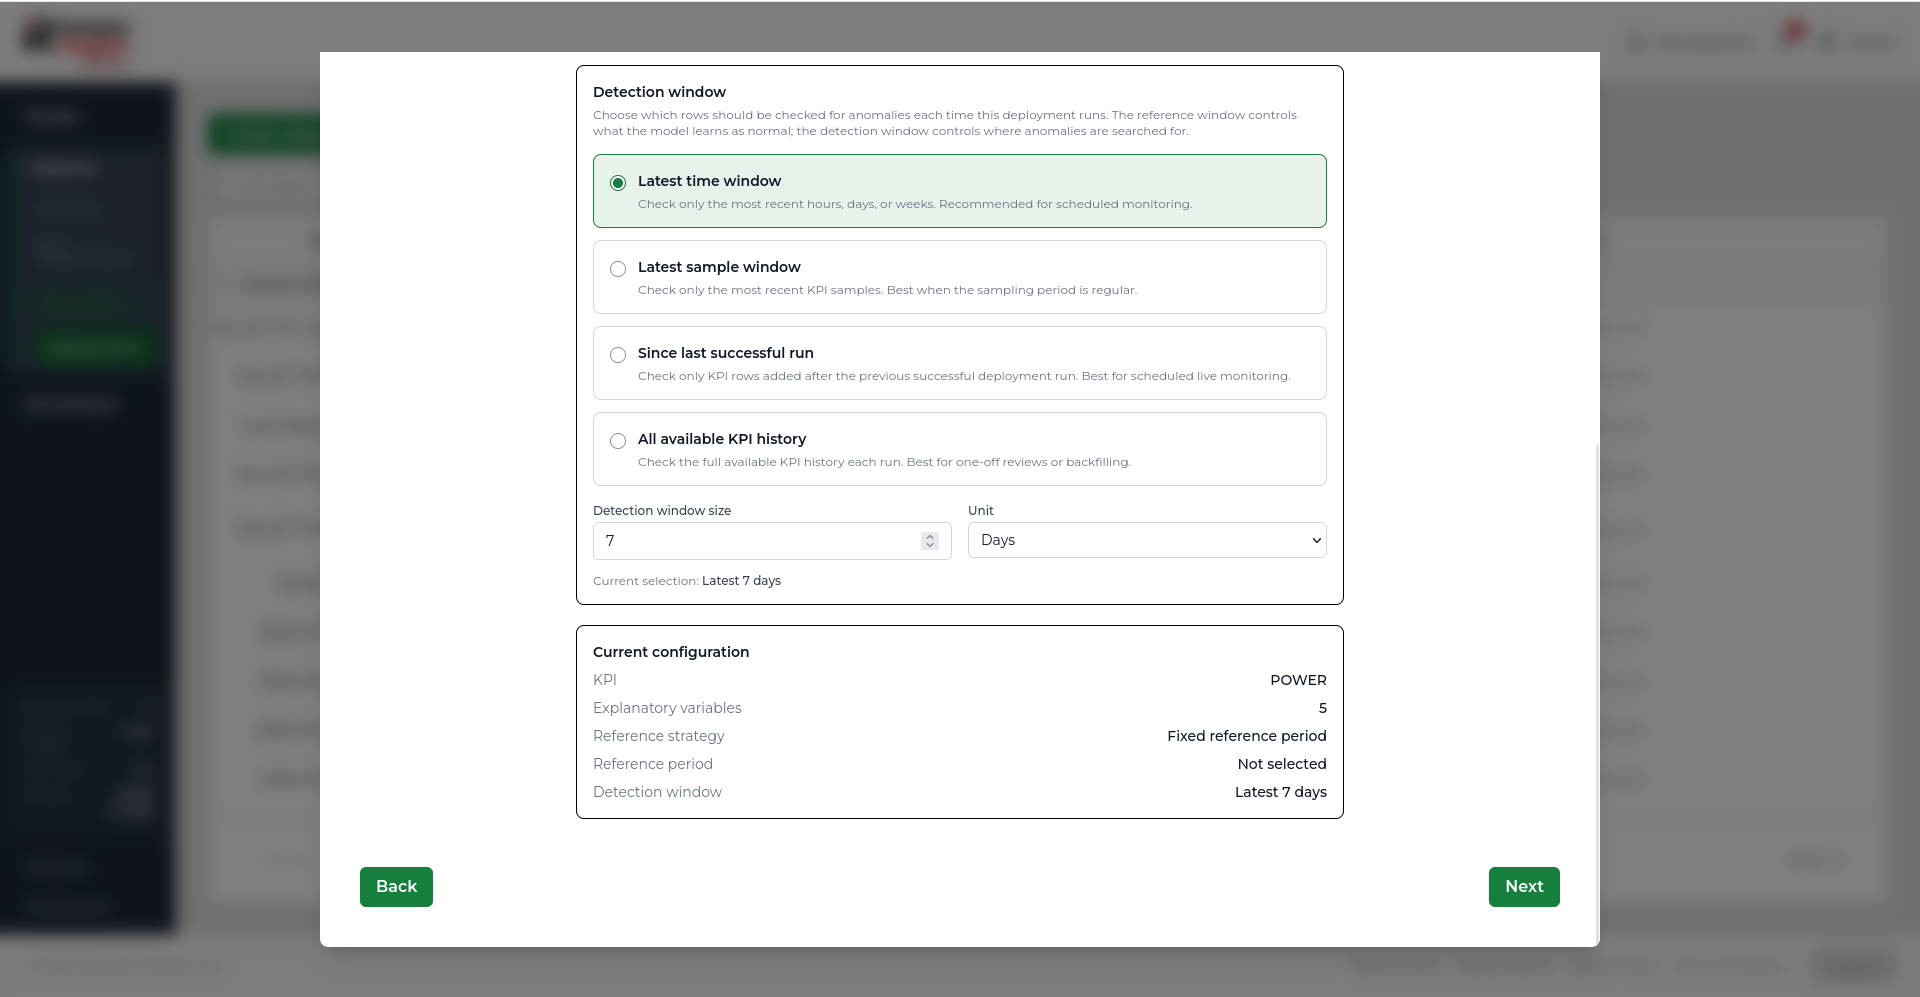
| Setting | Description |
|---|---|
| Latest time window | Checks only the most recent hours, days, or weeks. Recommended for scheduled monitoring. |
| Latest sample window | Checks only the most recent KPI samples. Useful when the sampling period is regular. |
| Since last successful run | Checks only KPI rows added after the previous successful deployment run. Useful for live monitoring. |
| All available KPI history | Checks the full available KPI history each run. Best for one-off reviews or backfilling. |
Step 4 - Summary
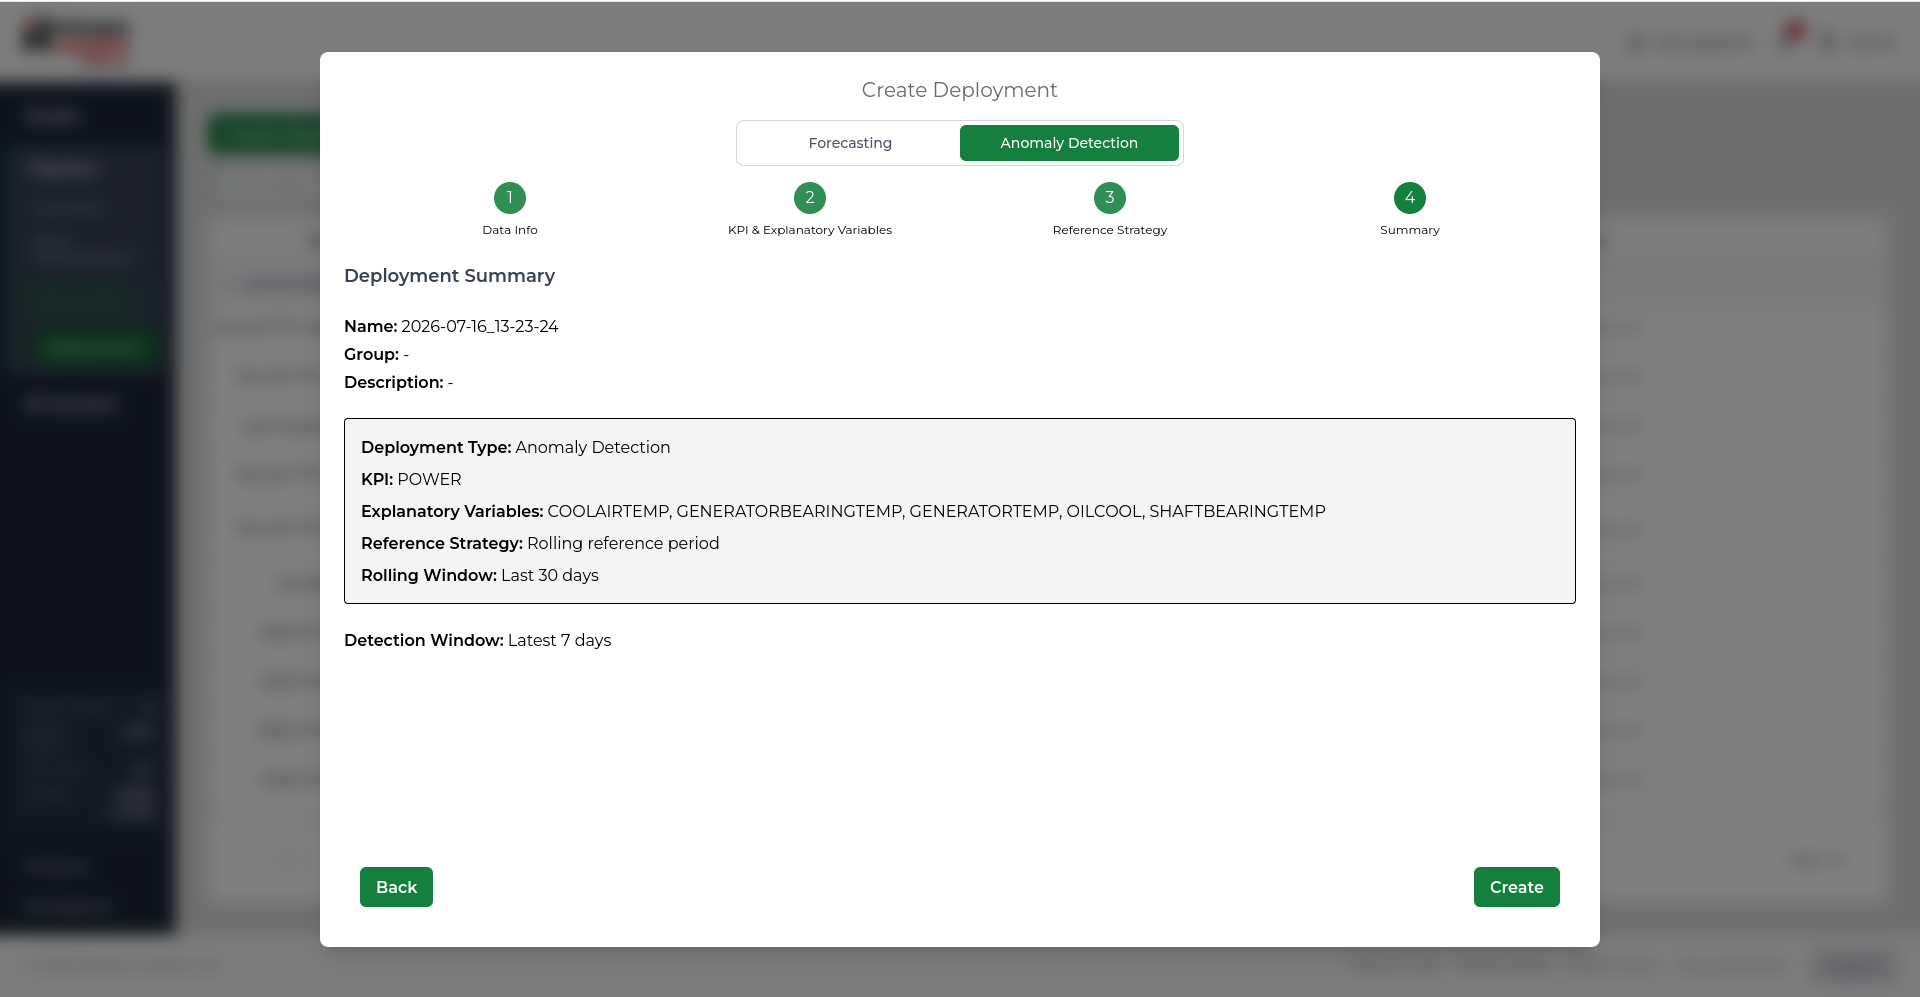
Review the deployment configuration before submitting.
The summary shows the selected deployment type and the key settings for that workflow. For forecasting deployments, this includes the target, predictors, forecast horizon, and engine settings. For anomaly detection deployments, this includes the KPI, explanatory variables, reference strategy, and detection window.
When everything is correct, click Create to create the deployment. The first run is queued after the deployment is created.
Deleting a deployment
- Click Delete on the deployment row.
- Confirm the deletion in the dialog.
Viewing latest and historic results
Once a deployment has completed at least one run, results can be opened from the deployment row.
Deployments provide two result views:
- Latest results - Opens the results page for the most recent completed deployment run.
- Historic results - Opens a history page where previous deployment runs can be reviewed and compared.
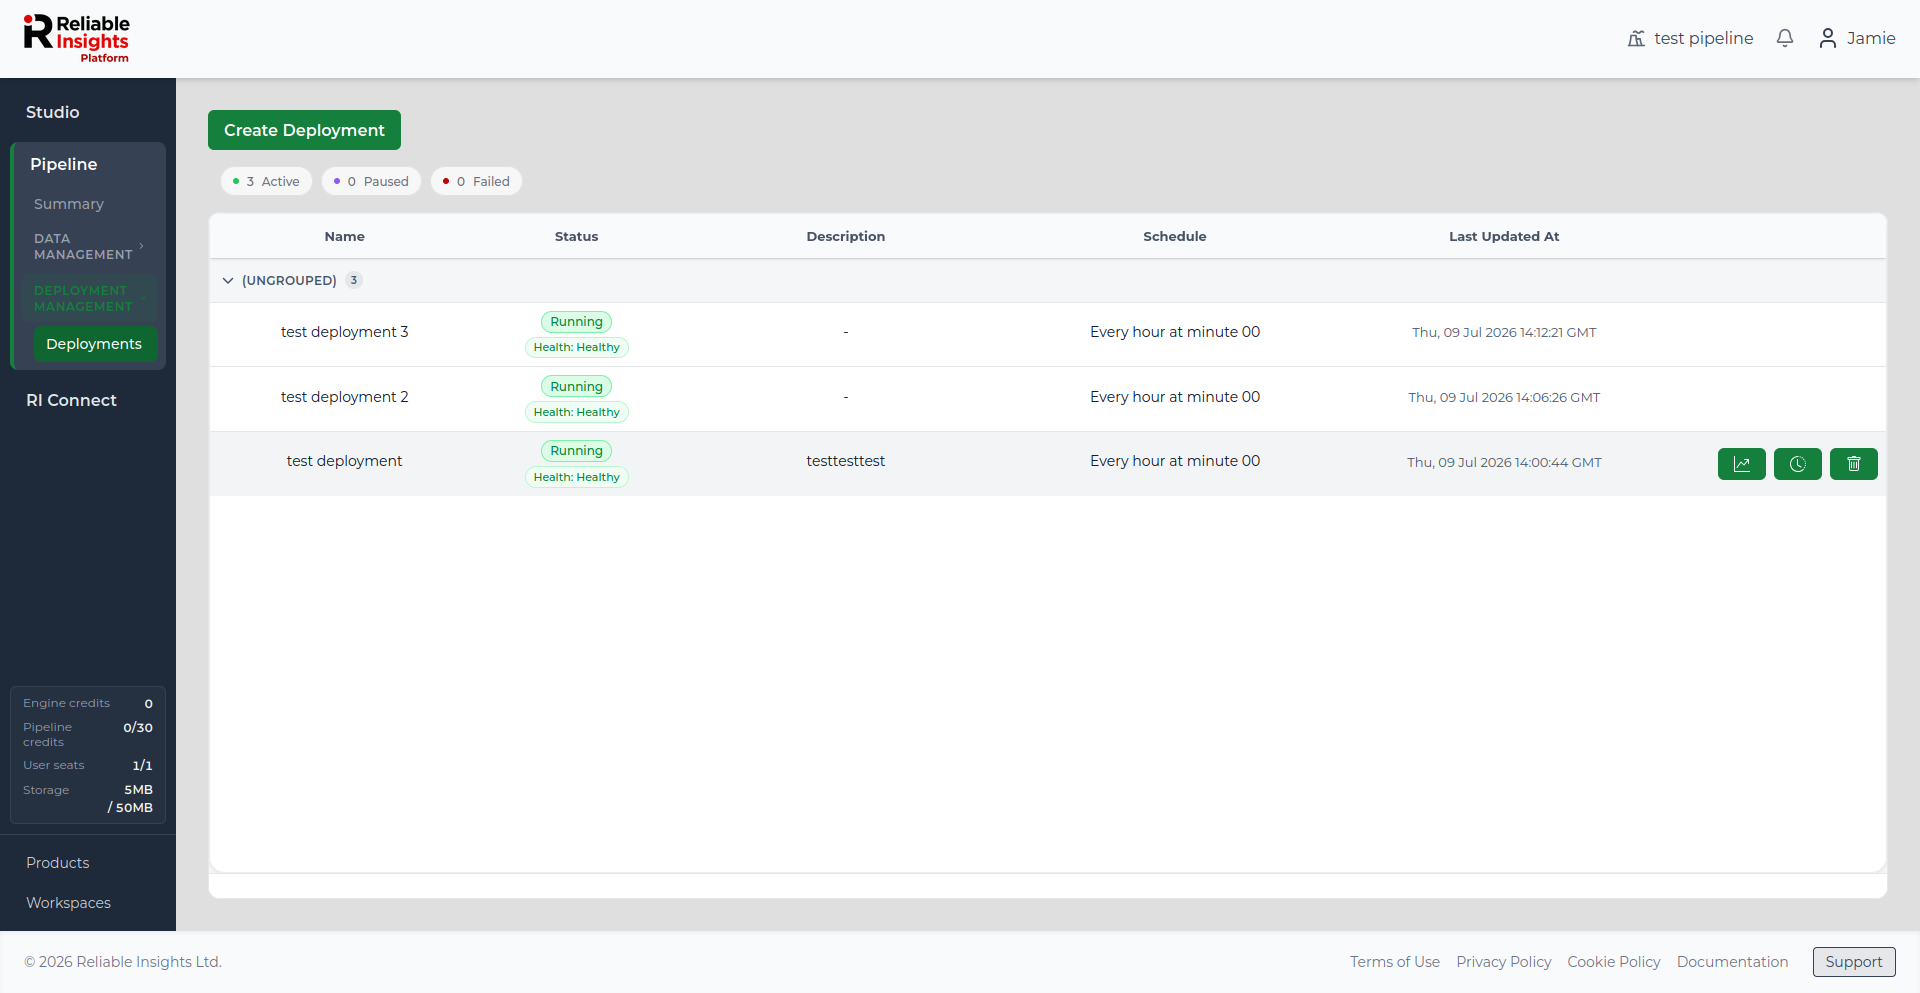
Use Latest results when you want to review the newest output from the deployment. Use Historic results when you want to compare previous runs, inspect how behaviour has changed over time, or open the results for a specific completed run.
See reading and exporting results for more information about the deployment results page.
Viewing historic results
The Historic Results page allows you to review previous runs for a deployment. This is useful when you want to understand how deployment behaviour has changed over time, compare previous runs, or open the results for a specific completed run.
The views shown on the Historic Results page depend on the deployment type.
For Forecasting deployments, the page can show:
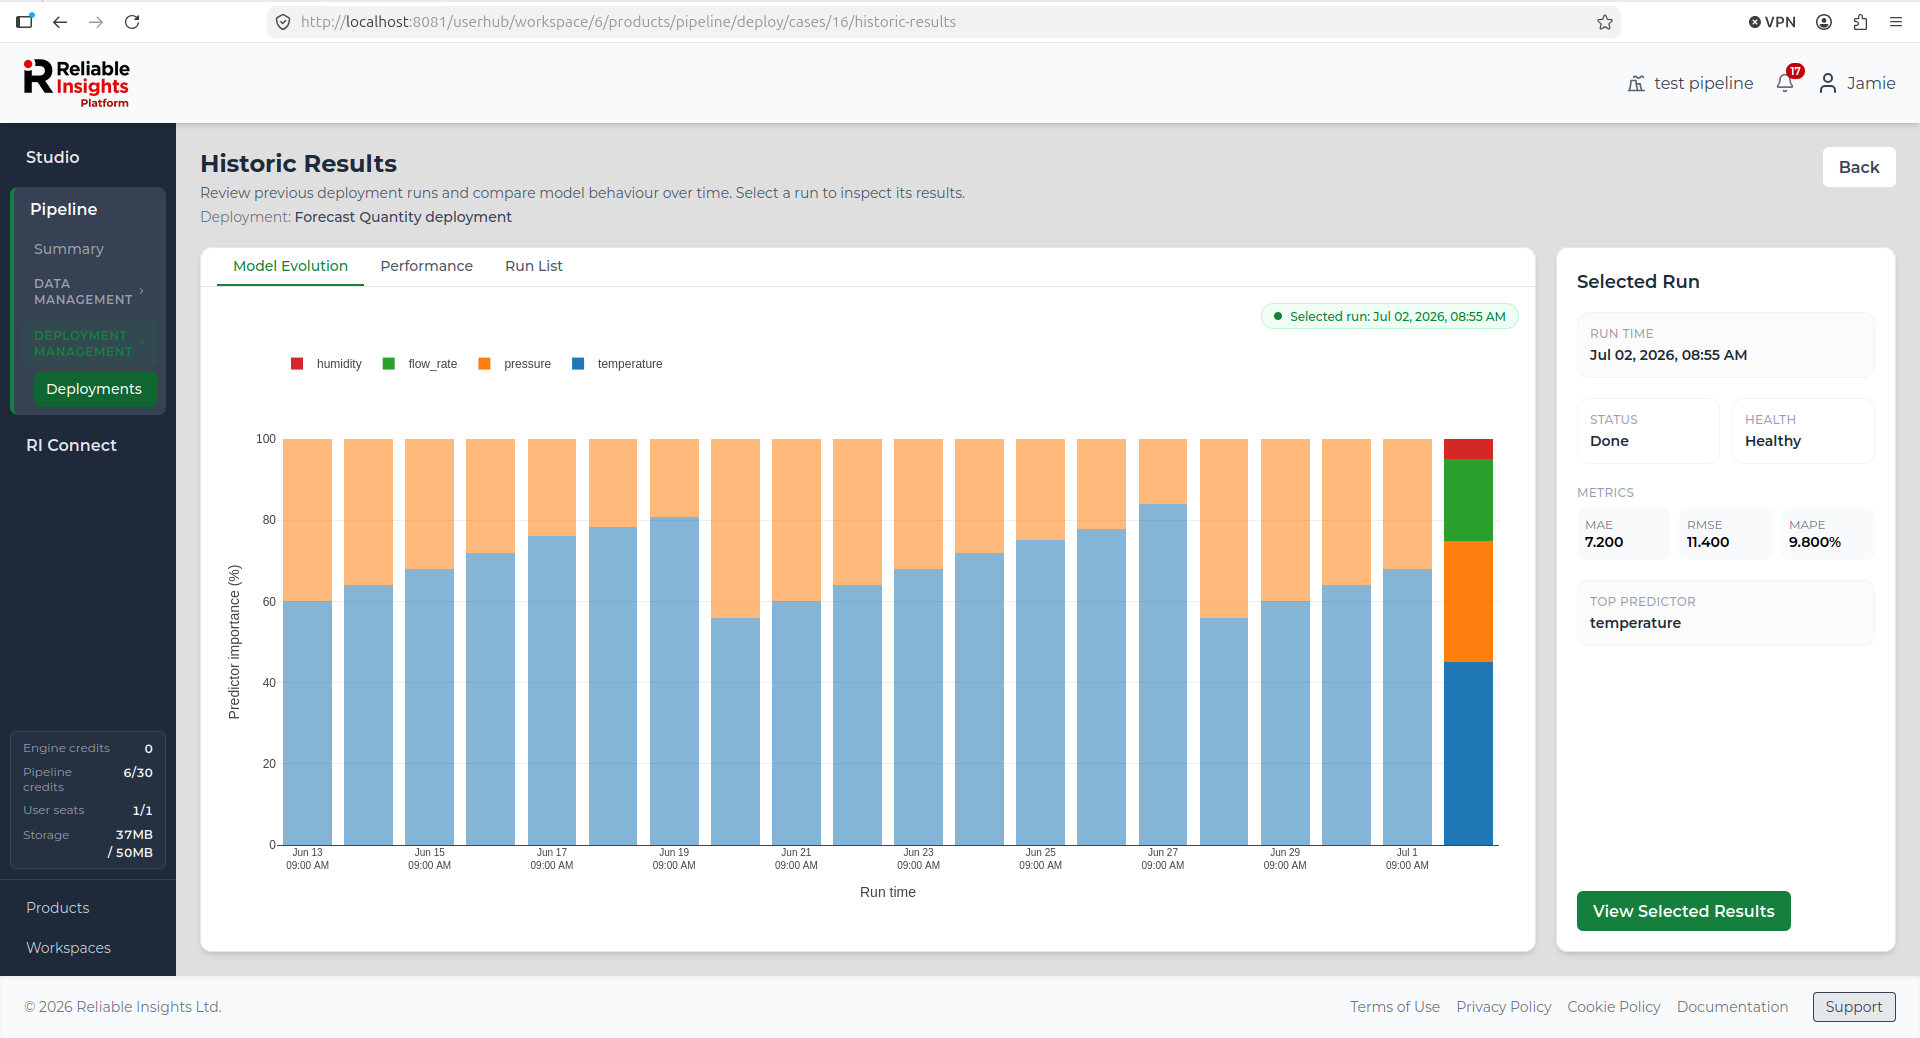
- Model Evolution - Shows how predictor importance changes across deployment runs.
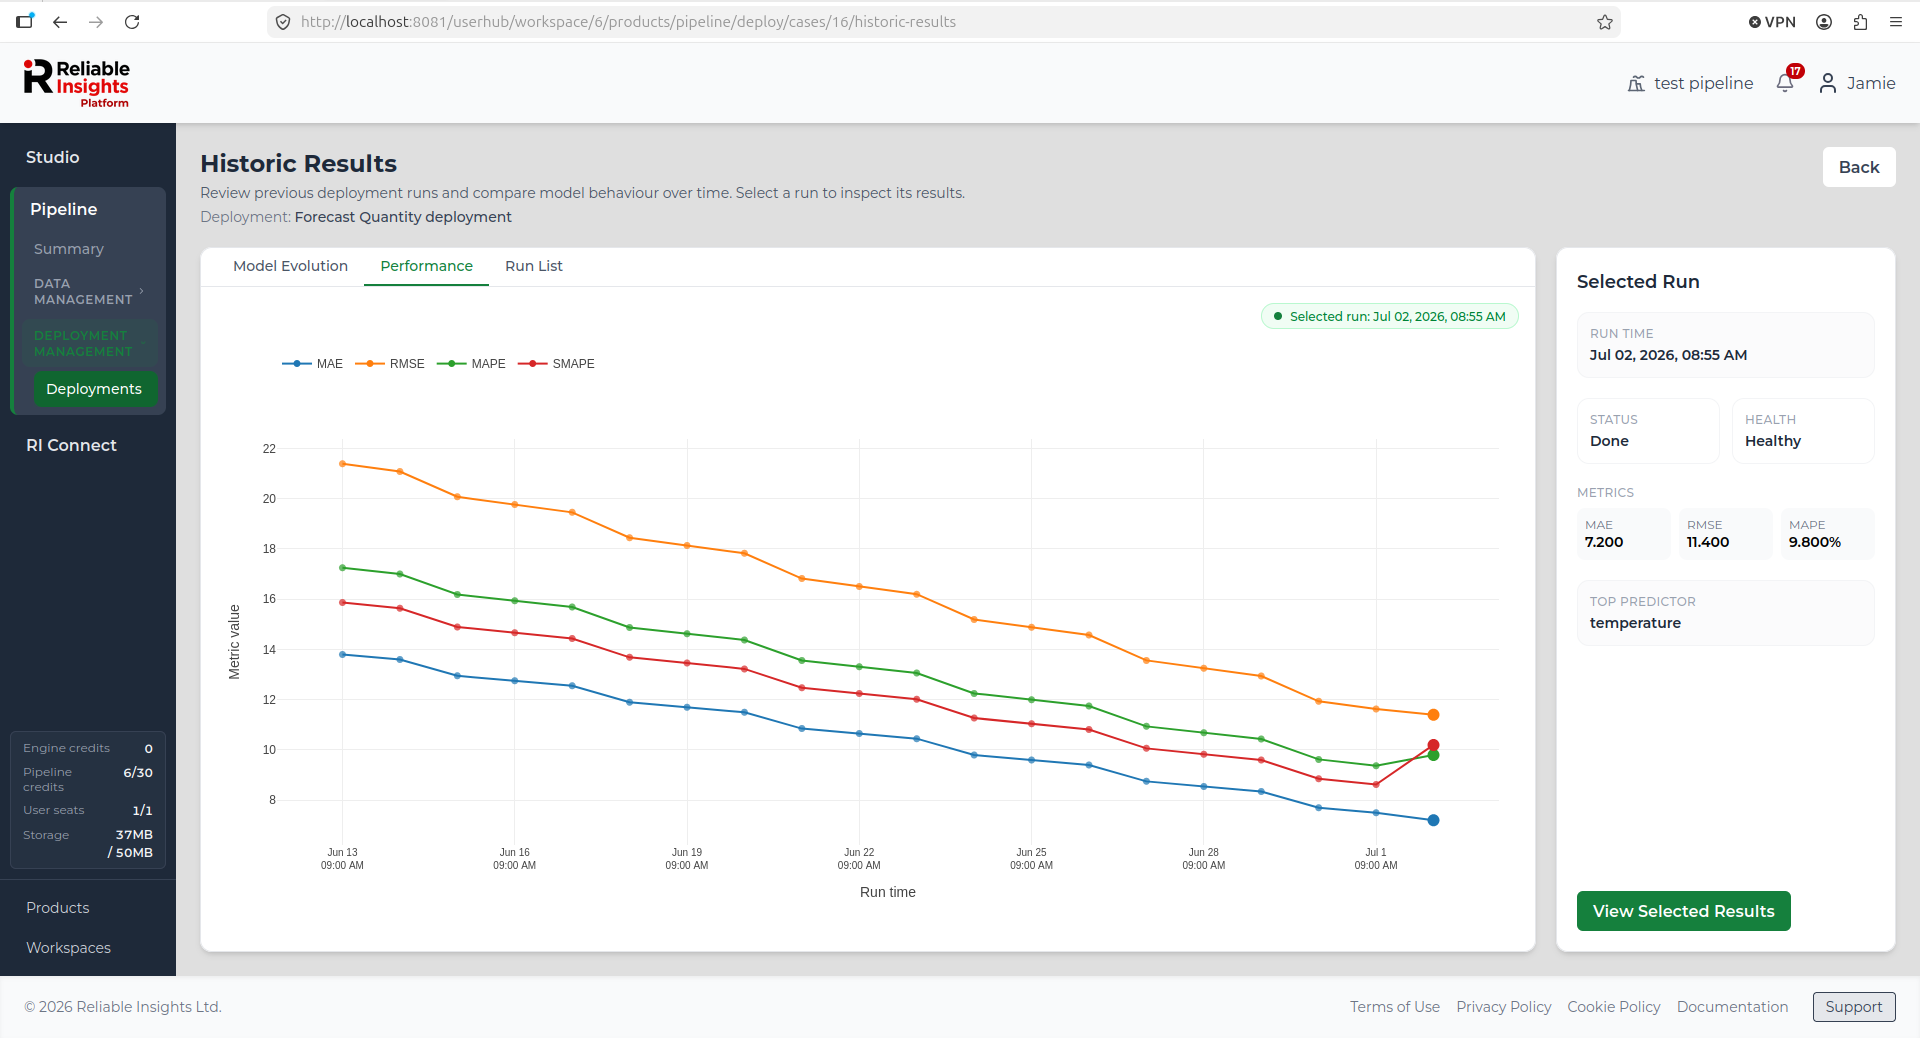
- Performance - Shows how model metrics change across deployment runs.
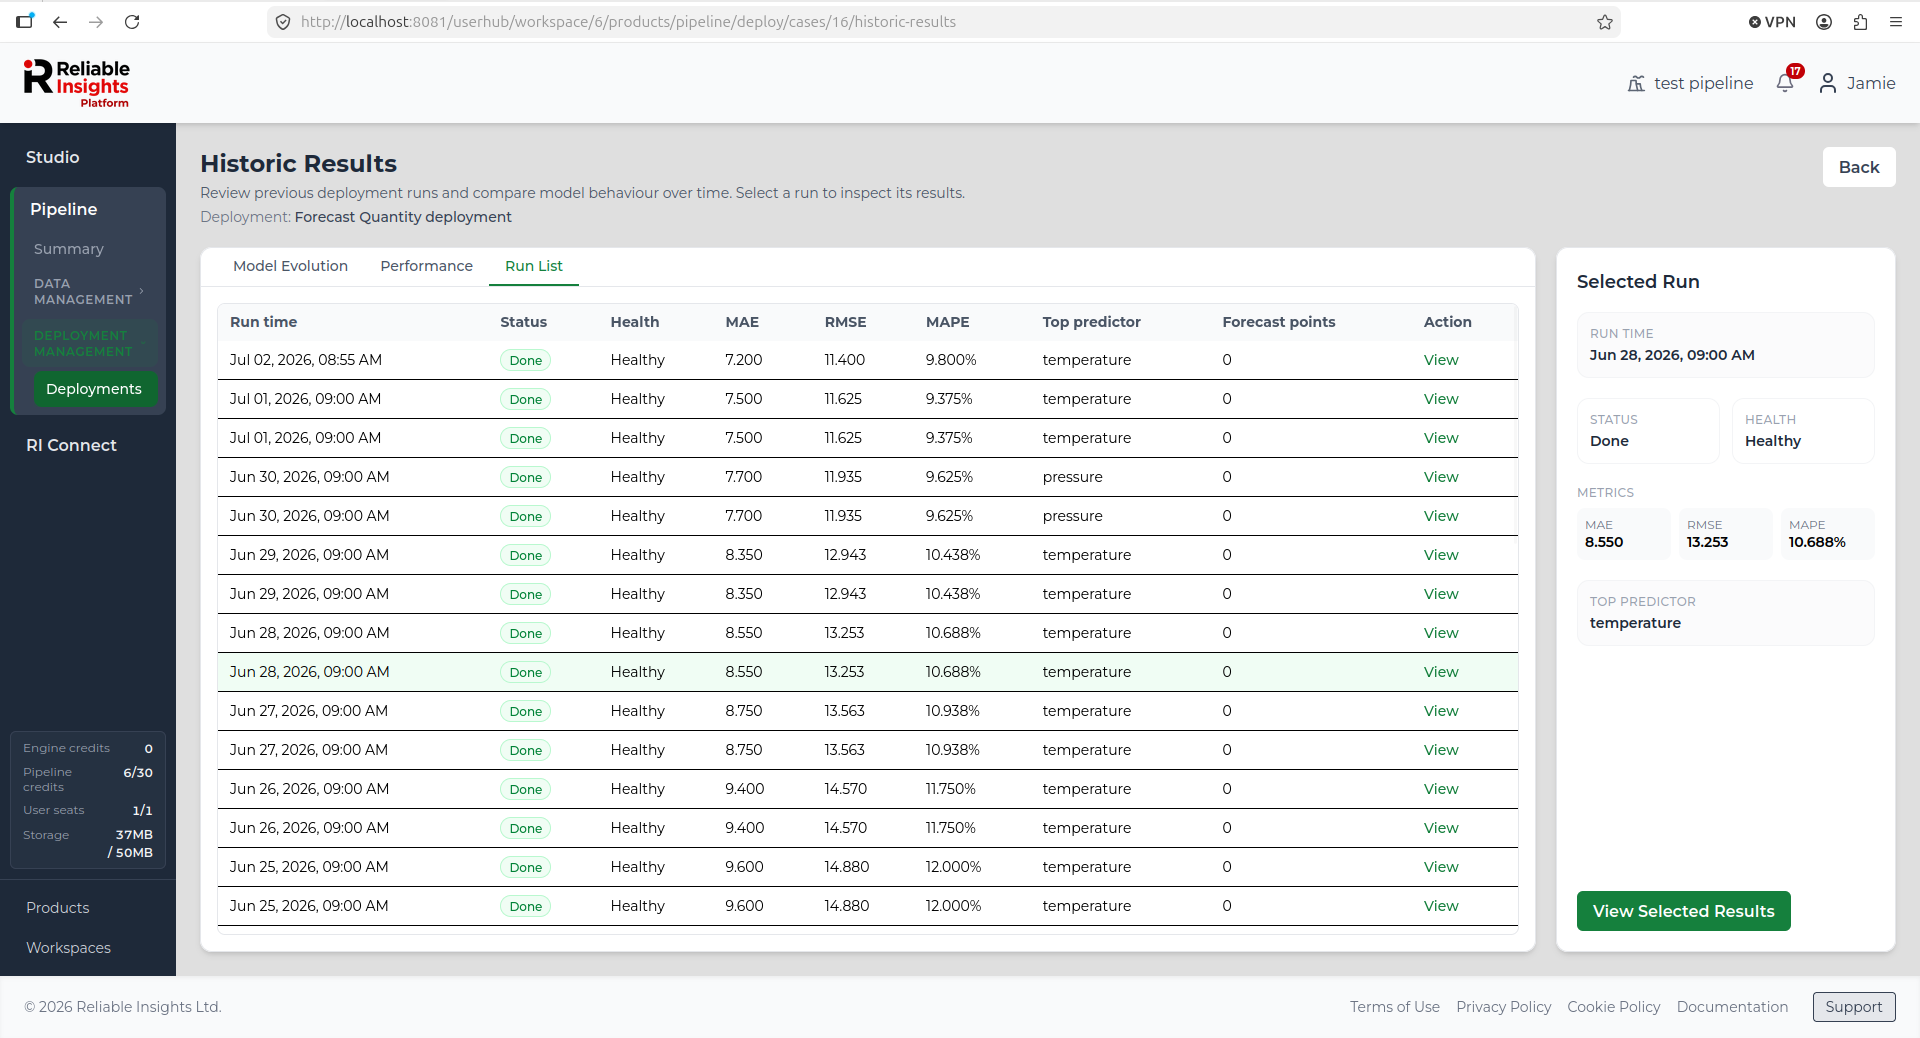
- Run List - Shows previous runs in a table so you can inspect and open a specific run.
For Anomaly Detection deployments, the page can show:
- Anomaly Drivers - Shows which explanatory variables were most associated with detected anomalies across deployment runs.
- Anomaly Activity - Shows how anomaly counts and anomaly rate change across deployment runs.
- Run List - Shows previous runs in a table so you can inspect and open a specific run.
A selected run is shown in the side panel. From there, you can review details such as run time, status, health, key metrics, top predictor or top anomaly driver, and open the selected run’s results.
Forecasting Model Evolution view
For forecasting deployments, the Model Evolution view shows predictor importance across previous deployment runs. This can help you see whether the same predictors are consistently important or whether the model is relying on different predictors over time.
Forecasting Performance view
For forecasting deployments, the Performance view shows model metrics across previous deployment runs. This can help you identify whether model performance is improving, degrading, or remaining stable over time.
Anomaly Drivers view
For anomaly detection deployments, the Anomaly Drivers view shows which explanatory variables were most associated with detected anomalies across previous runs.
This view follows the same layout as the forecasting Model Evolution view, but focuses on anomaly drivers rather than forecast predictor importance. It can help you understand whether the same variables are repeatedly linked to unusual behaviour, or whether the drivers change between deployment runs.
Anomaly Activity view
For anomaly detection deployments, the Anomaly Activity view shows how anomaly activity changes across previous deployment runs.
This view can help you compare:
- How many anomalies were detected in each run.
- The anomaly rate for each run.
- Whether anomaly activity is increasing, decreasing, or remaining stable.
- Which run should be opened for closer investigation.
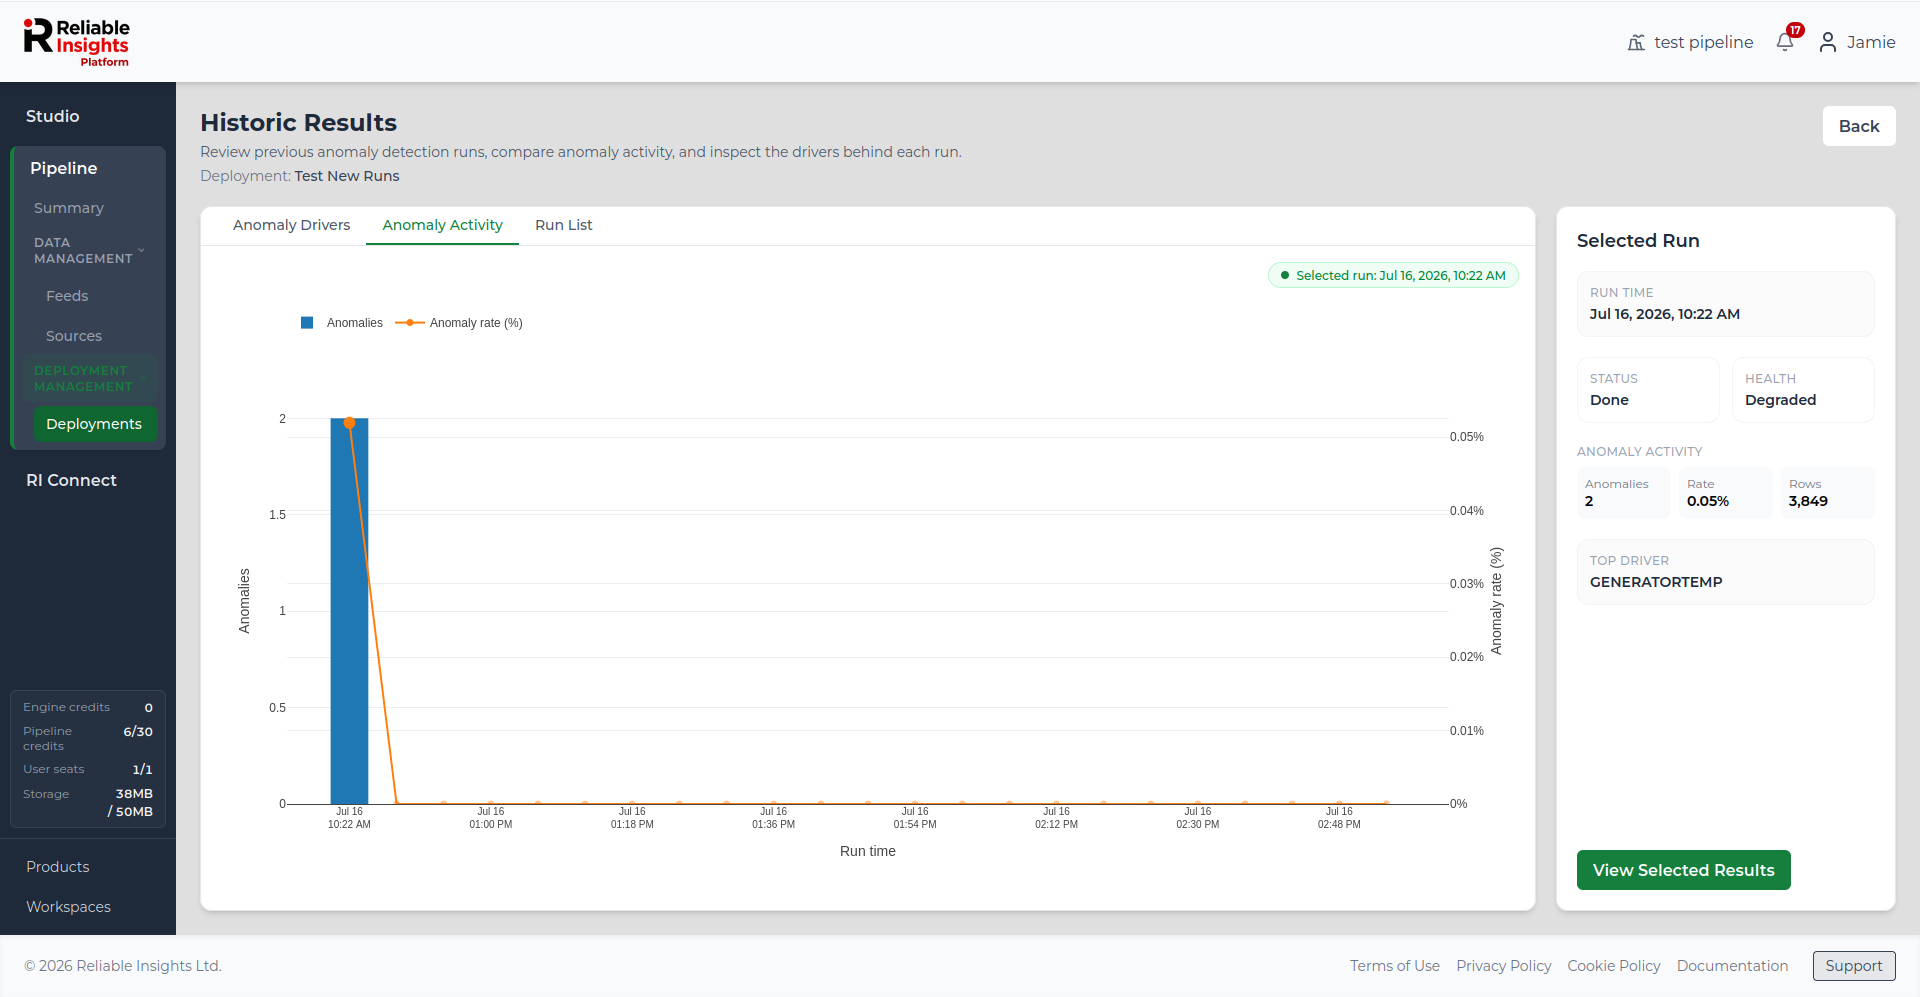
The side panel summarises the selected run, including the run time, status, health, anomaly count, anomaly rate, number of rows checked, and top driver. Select View Selected Results to open the full results page for that run.
Run List view
The Run List view shows individual deployment runs in a table.
For forecasting deployments, each row may include information such as run time, status, health, metrics, top predictor, and forecast points.
For anomaly detection deployments, each row may include information such as run time, status, health, anomaly activity, rows checked, and top driver.
Select a run to view its details in the side panel. Click View Selected Results to open the full results page for that run.
Troubleshooting deployments
Deployment is stuck in Running
A run should usually complete within a few minutes, depending on the amount of data and the deployment configuration.
If a deployment has shown Running for longer than expected:
- Check the Alerts panel for critical alerts related to the deployment.
- Check whether the datasource is still reachable.
- If no alert is visible and the run does not complete, contact your administrator or use the Support button.
Deployment failed
If a deployment run fails:
- Open the Alerts panel.
- Find the alert for the failed deployment or run.
- Review the alert message to understand what went wrong.
- Resolve the underlying issue, such as a datasource connection problem or missing feed data.
No results available after the run completed
- Navigate to Deployments and open the latest results or historic results from the deployment row.
- If no Results link is visible, the run may still be queued or running. Refresh the page.
- If the deployment shows Active but results are not accessible, check the Alerts panel for any warnings on the deployment.
Historic results are not showing
If historic results are not available:
- Check that the deployment has completed more than one run.
- Refresh the Deployments page and try opening the historic results again.
- Check whether recent deployment runs have failed.
- Review the Alerts panel for warnings or errors related to the deployment.
- If previous results are still missing, contact your administrator or use the Support button.