Alerts
The Alerts panel collects notifications raised by Pipeline when something needs your attention. Rather than having to check each datasource and deployment manually, alerts surface problems automatically - so you can respond quickly and keep your workflows running.
Access the Alerts panel via the bell icon in the top navigation bar. An unread badge shows the count of unread alerts.

Alert types
Each alert is assigned a severity level to help you prioritise your response.
Critical - A serious failure that is likely affecting your data or forecasts. Requires immediate action.
Major - A significant problem that should be investigated soon.
Minor - A lesser issue that is worth reviewing but not urgent.
Info - A neutral informational event - no action required.
Viewing alerts
- Click the bell icon in the top navigation bar.
- The Alerts panel opens. Unread alerts are highlighted with a red left border.
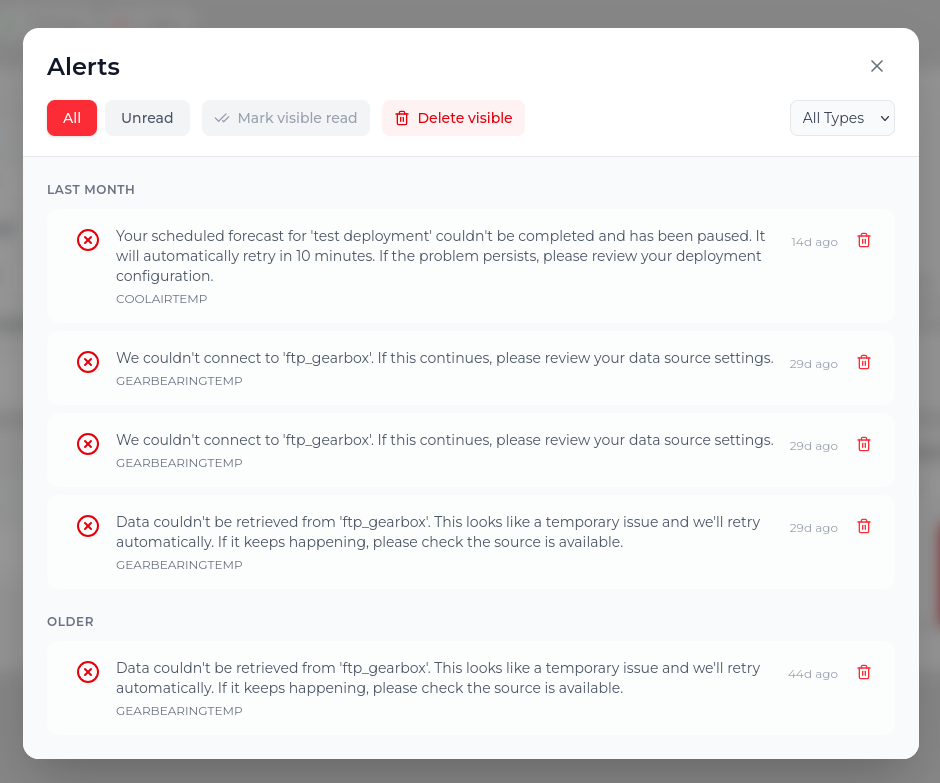
Alerts
- Click any alert to open its detail view and read the full message.
- Clicking an alert also marks it as read - the unread count badge decrements.
Filtering alerts:
- All / Unread toggle - switch between showing all alerts or only unread ones.
- Type filter - filter by alert type (All Types, Critical, Warning, Info, Success).
Alerts are grouped by recency: Today, Last Week, Last Month, and Older.
What triggers alerts
| Situation | Typical alert type |
|---|---|
| Datasource is unreachable (connection refused, timeout) | Critical |
| Authentication failed on a datasource | Critical |
| Data pull returned no rows or an unexpected format | Major |
| Data quality check detected gaps or outliers | Minor |
| Deployment run failed | Critical |
| Deployment run completed successfully | Info |
| Feature has been unhealthy for an extended period | Major |
Acting on alerts
Most alerts include enough detail in the message to identify what failed. The general approach is:
- Read the alert message carefully - it will usually name the datasource or feature involved and describe the error.
- Navigate to the relevant page (Datasources or Features) and investigate.
- Fix the underlying issue (update credentials, upload corrected data, etc.).
- The next scheduled pull or run will attempt again automatically. You do not need to manually retry.