Feeds
A feed is a single time series: one value column, with timestamps, pulled from a datasource on a repeating schedule.
Pipeline uses feeds as the time-series inputs for forecasting workflows. The quality and freshness of your feeds directly affects the quality of your forecasts.
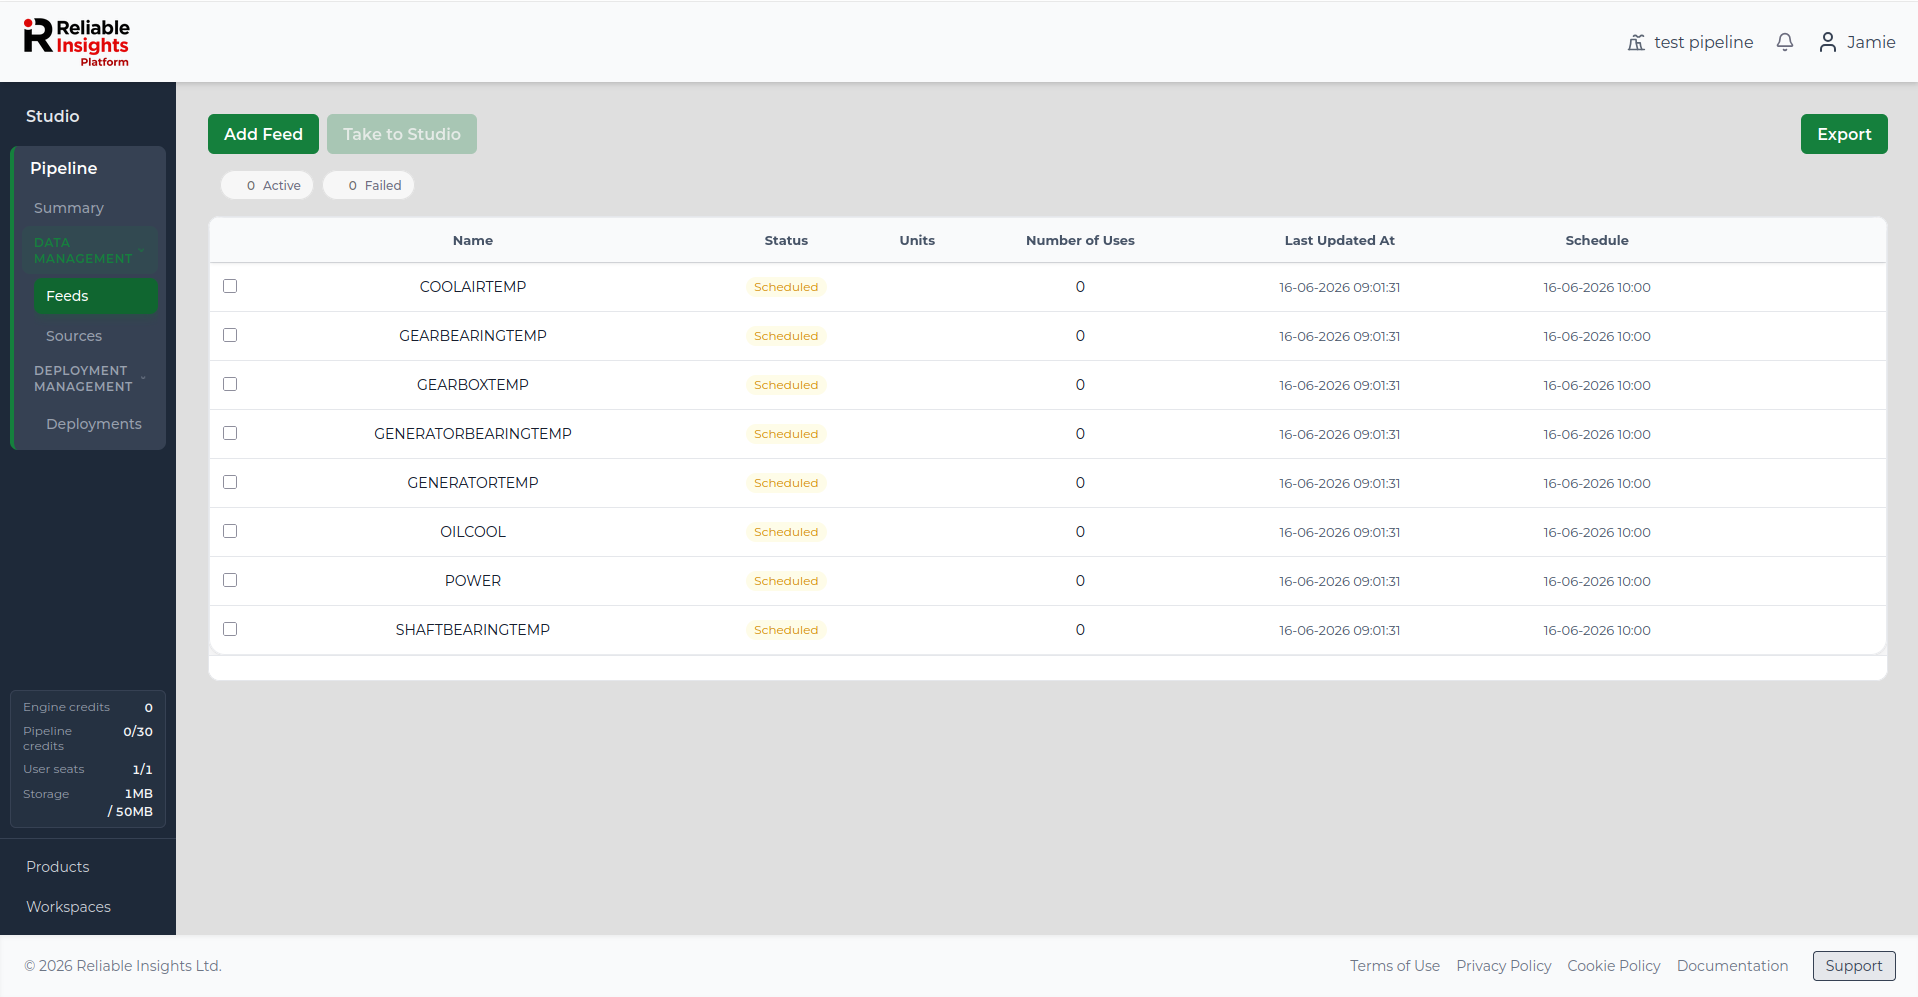
Statuses
Pipeline tracks the health of each feed through its pull cycle and data quality checks.
Pending - Waiting for the next scheduled pull.
Pulling - A data pull is in progress right now.
Pulled - The most recent pull completed successfully.
Pull Failed - The most recent pull encountered an error. Check alerts for details.
Healthy - Feature has a consistent, good-quality data history.
Unhealthy - Data quality issues were detected (gaps, unexpected nulls, format errors).
Archived - Feature has been deactivated and is no longer being pulled.
Adding feeds from a datasource
You can only add new feeds if your workspace has available Pipeline credits. If no Pipeline credits are available, you will need to free up existing credits or update your subscription before adding more feeds.
Feeds are created from an existing datasource. The exact fields shown during feed setup depend on the datasource type.
- Go to Feeds in the left sidebar.
- Click Add Feed.
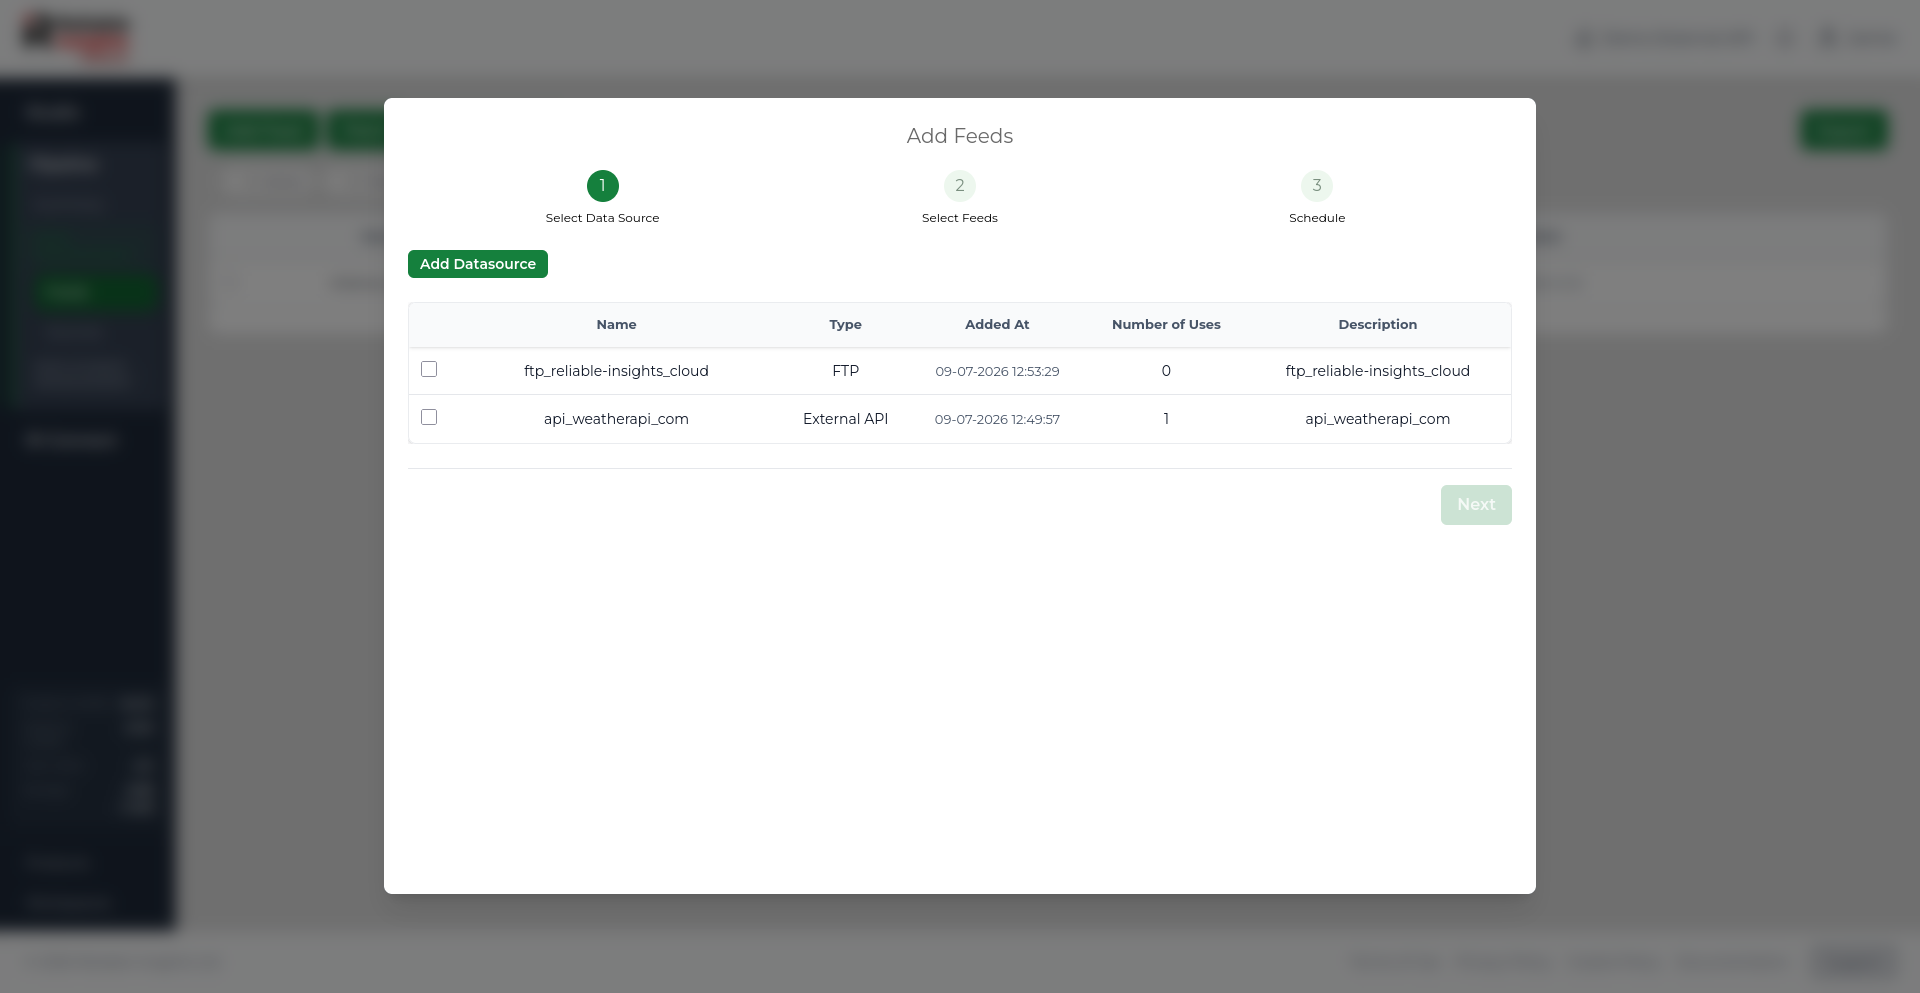
- Step 1 - Select datasource: Choose a datasource from the list of registered datasources.
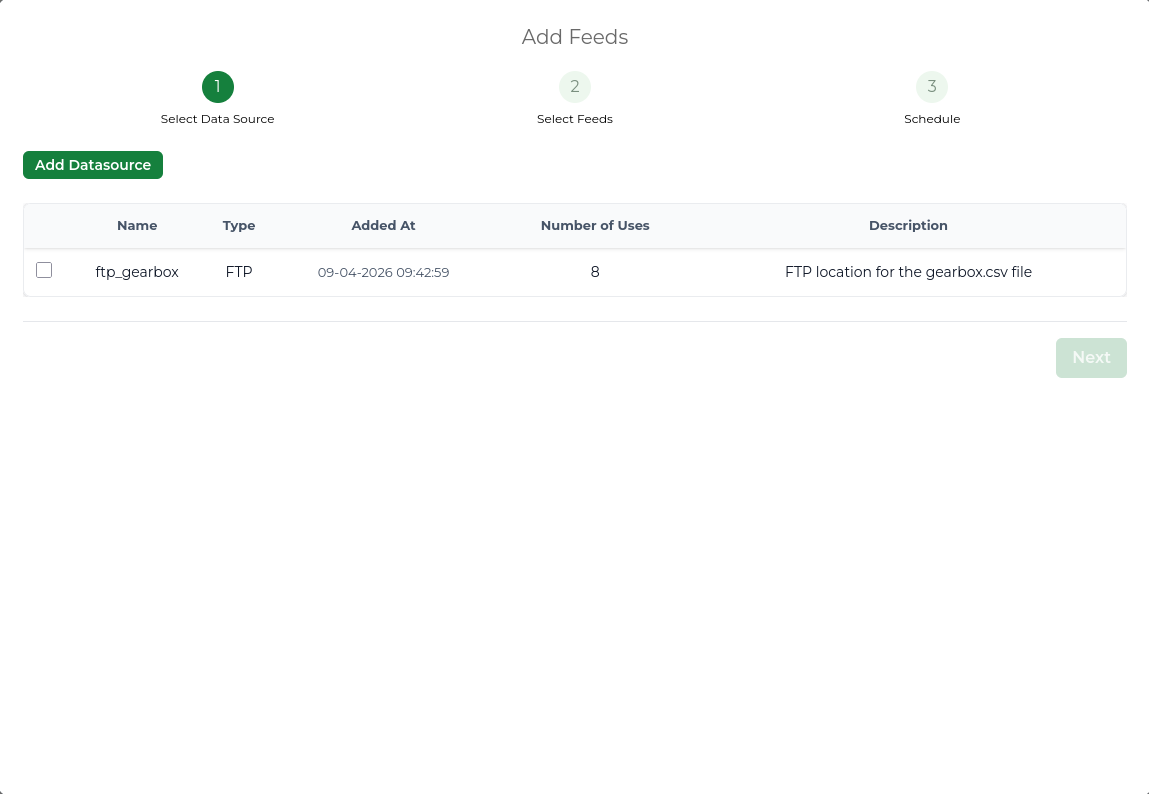
The datasource list may include file transfer datasources, such as SFTP or FTPS, and External API datasources.
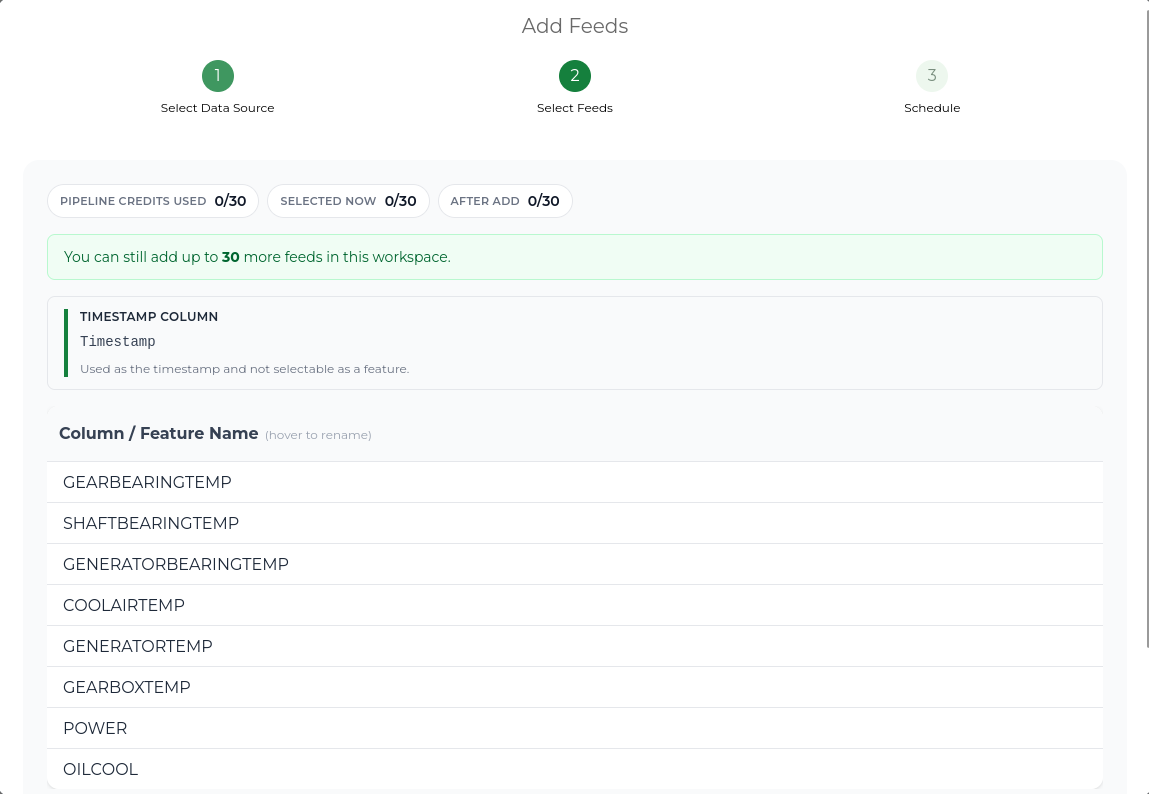
Selecting feeds from a file transfer datasource
For file transfer datasources, Pipeline reads the columns available from the selected file. Select each column you want to track as a feed, and identify which column contains the timestamps.
Selecting feeds from an External API datasource
For External API datasources, Pipeline shows the fields detected from the API response.
Select the numeric API fields that you want to create as Pipeline feeds. You also need to confirm the timestamp field, timestamp format, and timezone so Pipeline can store the data correctly.
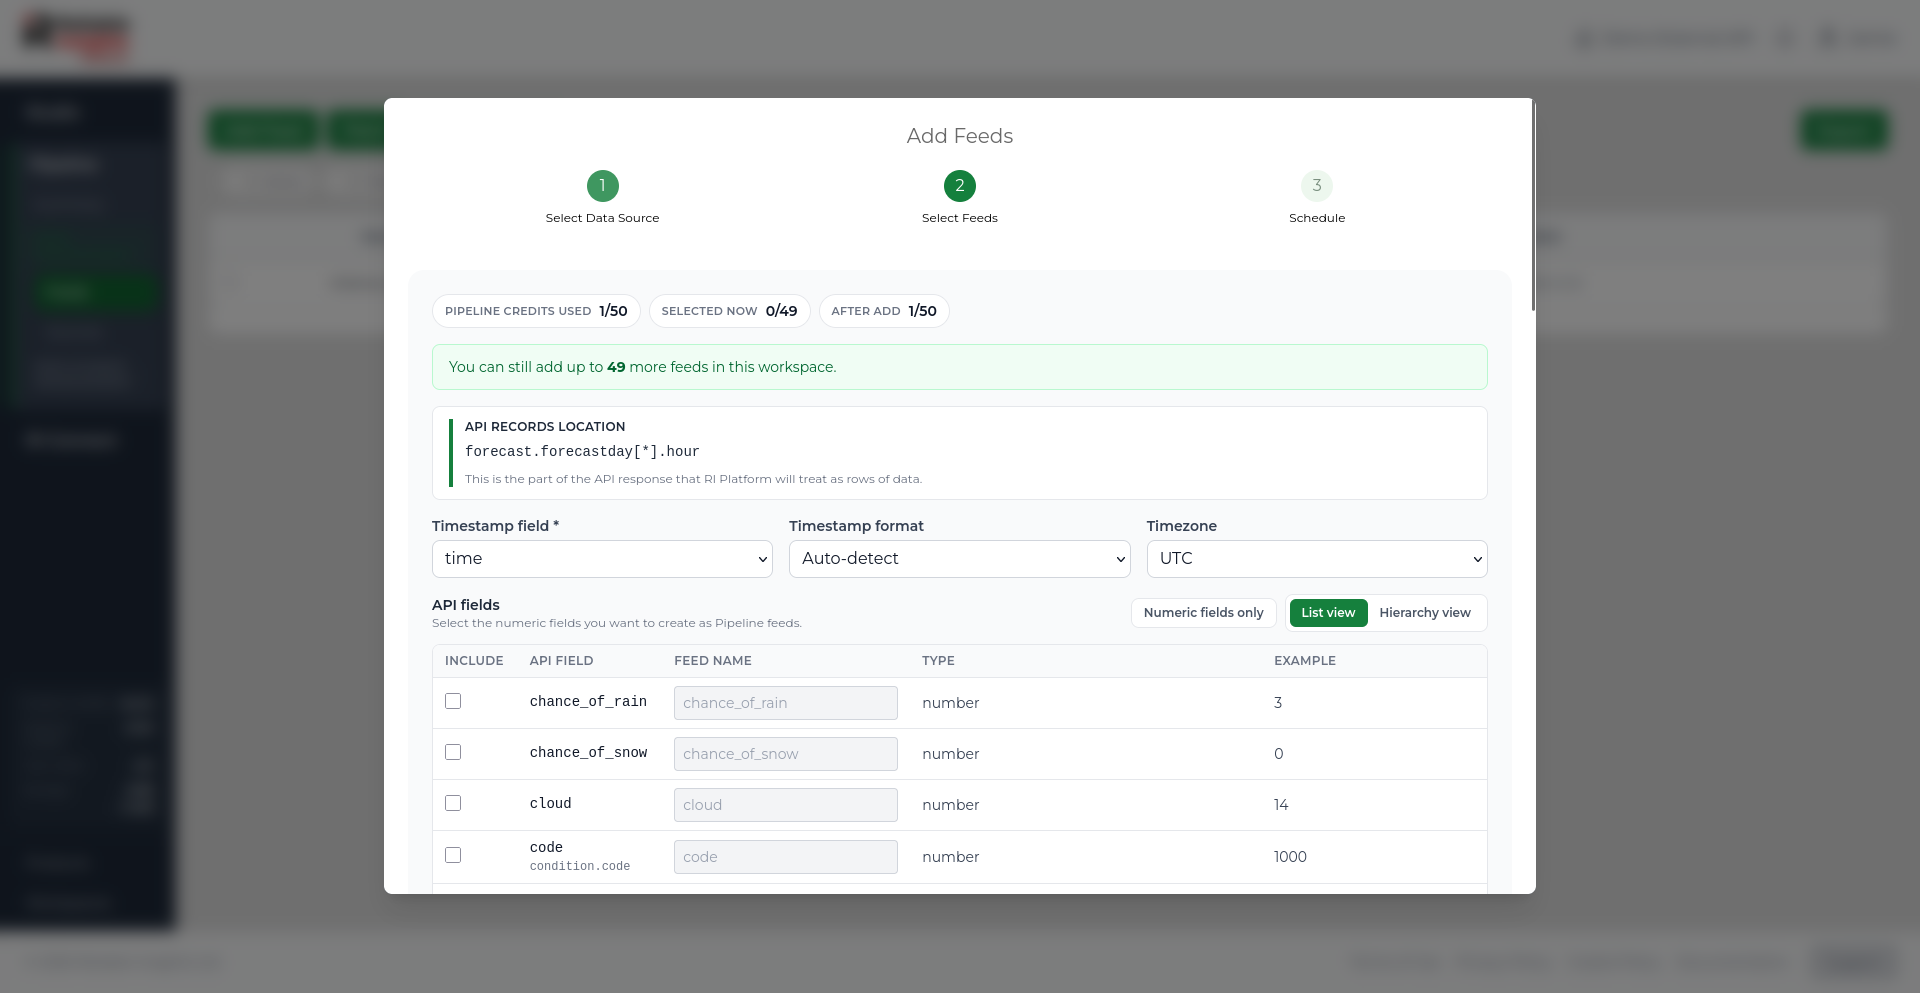
External API fields can be reviewed in List view or Hierarchy view. Hierarchy view is useful when the API response contains nested fields. Only numeric fields can be selected as Pipeline feeds.
The API records location is inherited from the datasource test step. It tells Pipeline which part of the API response should be treated as rows of data.
Scheduling feeds
When adding feeds, choose how Pipeline should schedule data pulls.
- Union Schedule - Uses one shared schedule for all selected feeds.
- Individual Schedules - Lets you configure a different schedule for each feed.
For External API datasources, Union Schedule is recommended. RI Platform can call the API once and update all selected feeds from the same response.
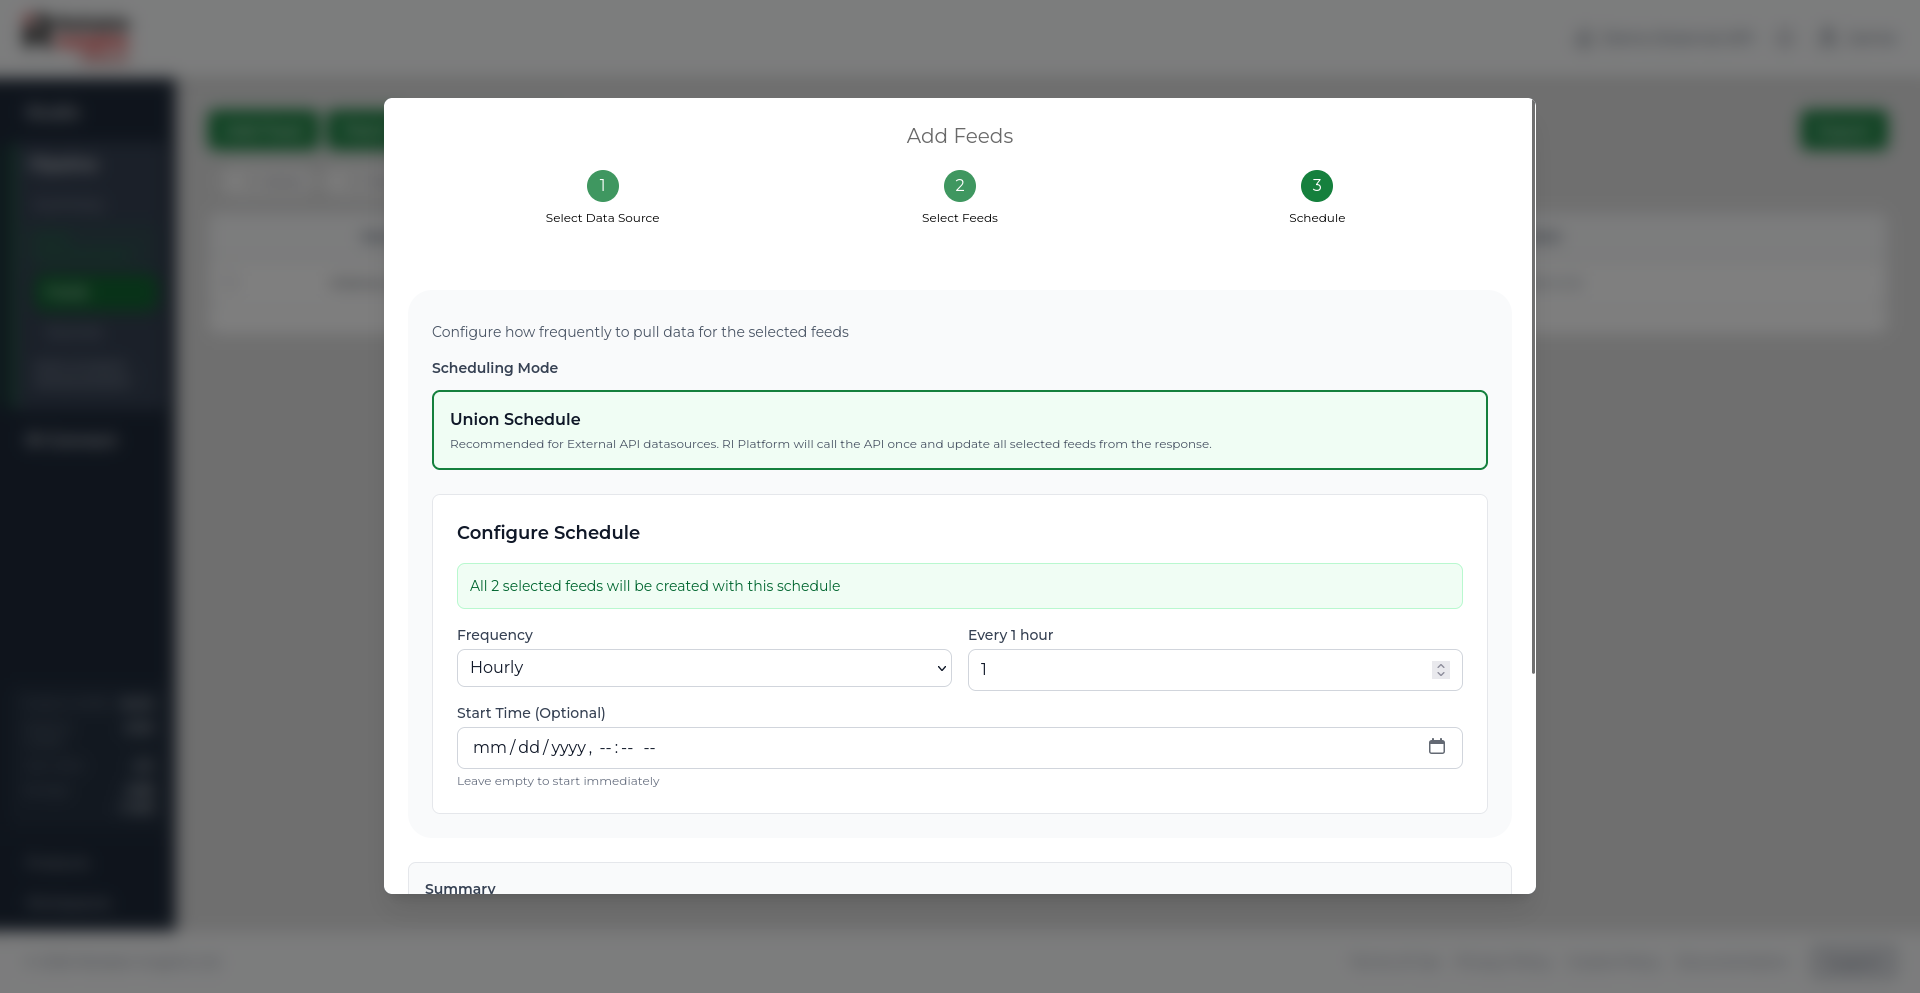
For other datasource types, you can use one shared schedule or configure feeds independently, depending on how often each feed should be updated.
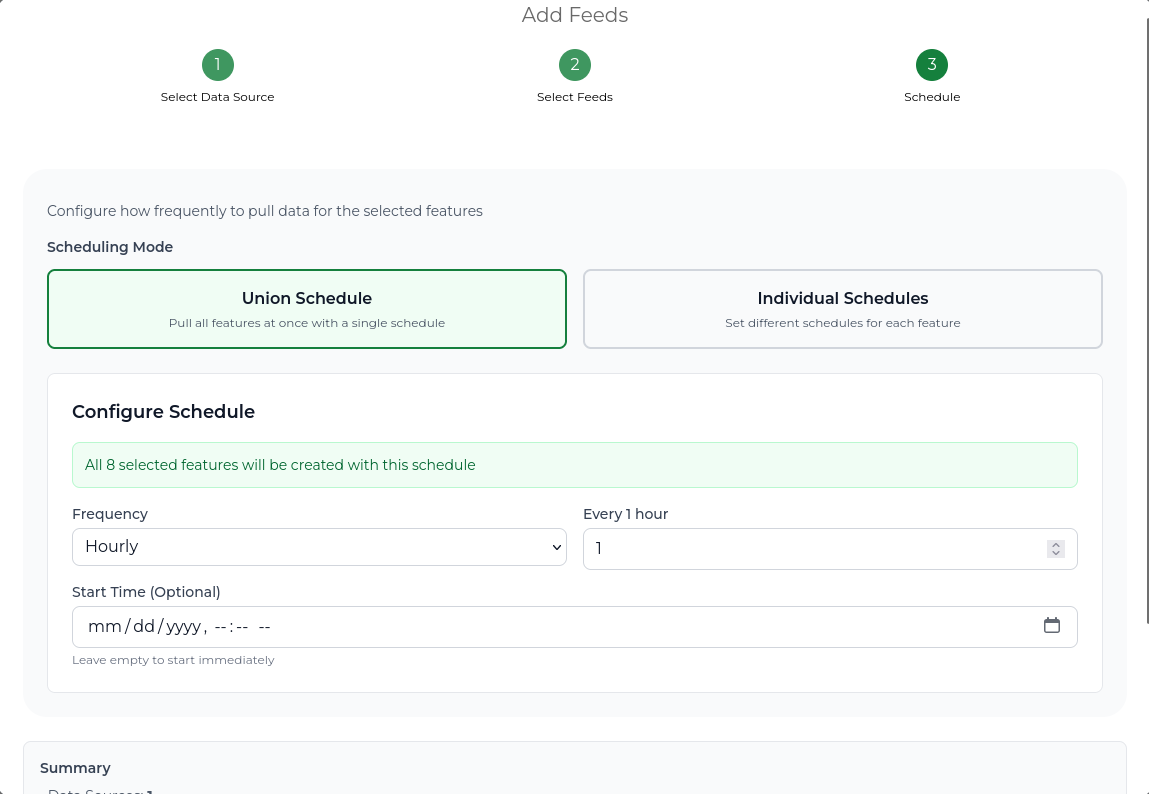
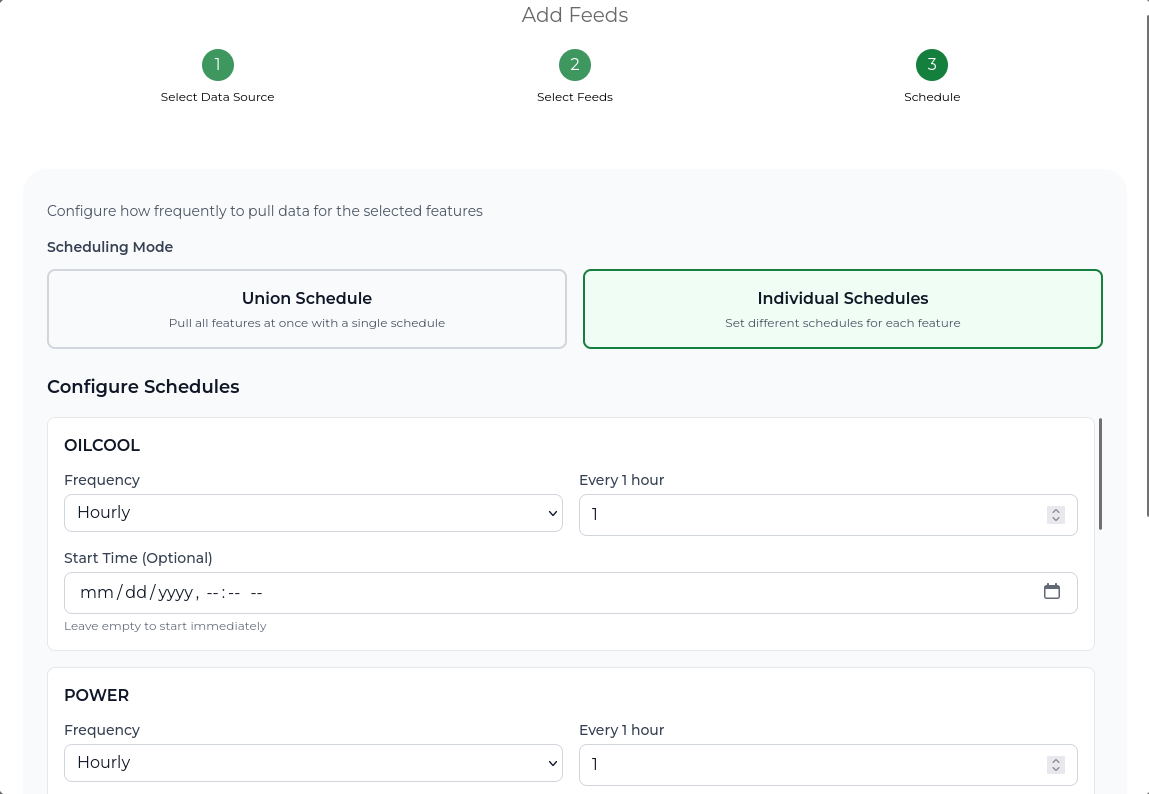
Click Save. The feeds appear in the table and will begin pulling on their schedule.
Patching feed data
Use Patch when you want to backfill or correct existing Pipeline feeds using a CSV file.
This is useful when you have historical data that needs to be added to Pipeline, or when you need to fill gaps in existing feed data. A patch file can contain one timestamp column and one or more value columns. Each value column can be mapped to an existing Pipeline feed.
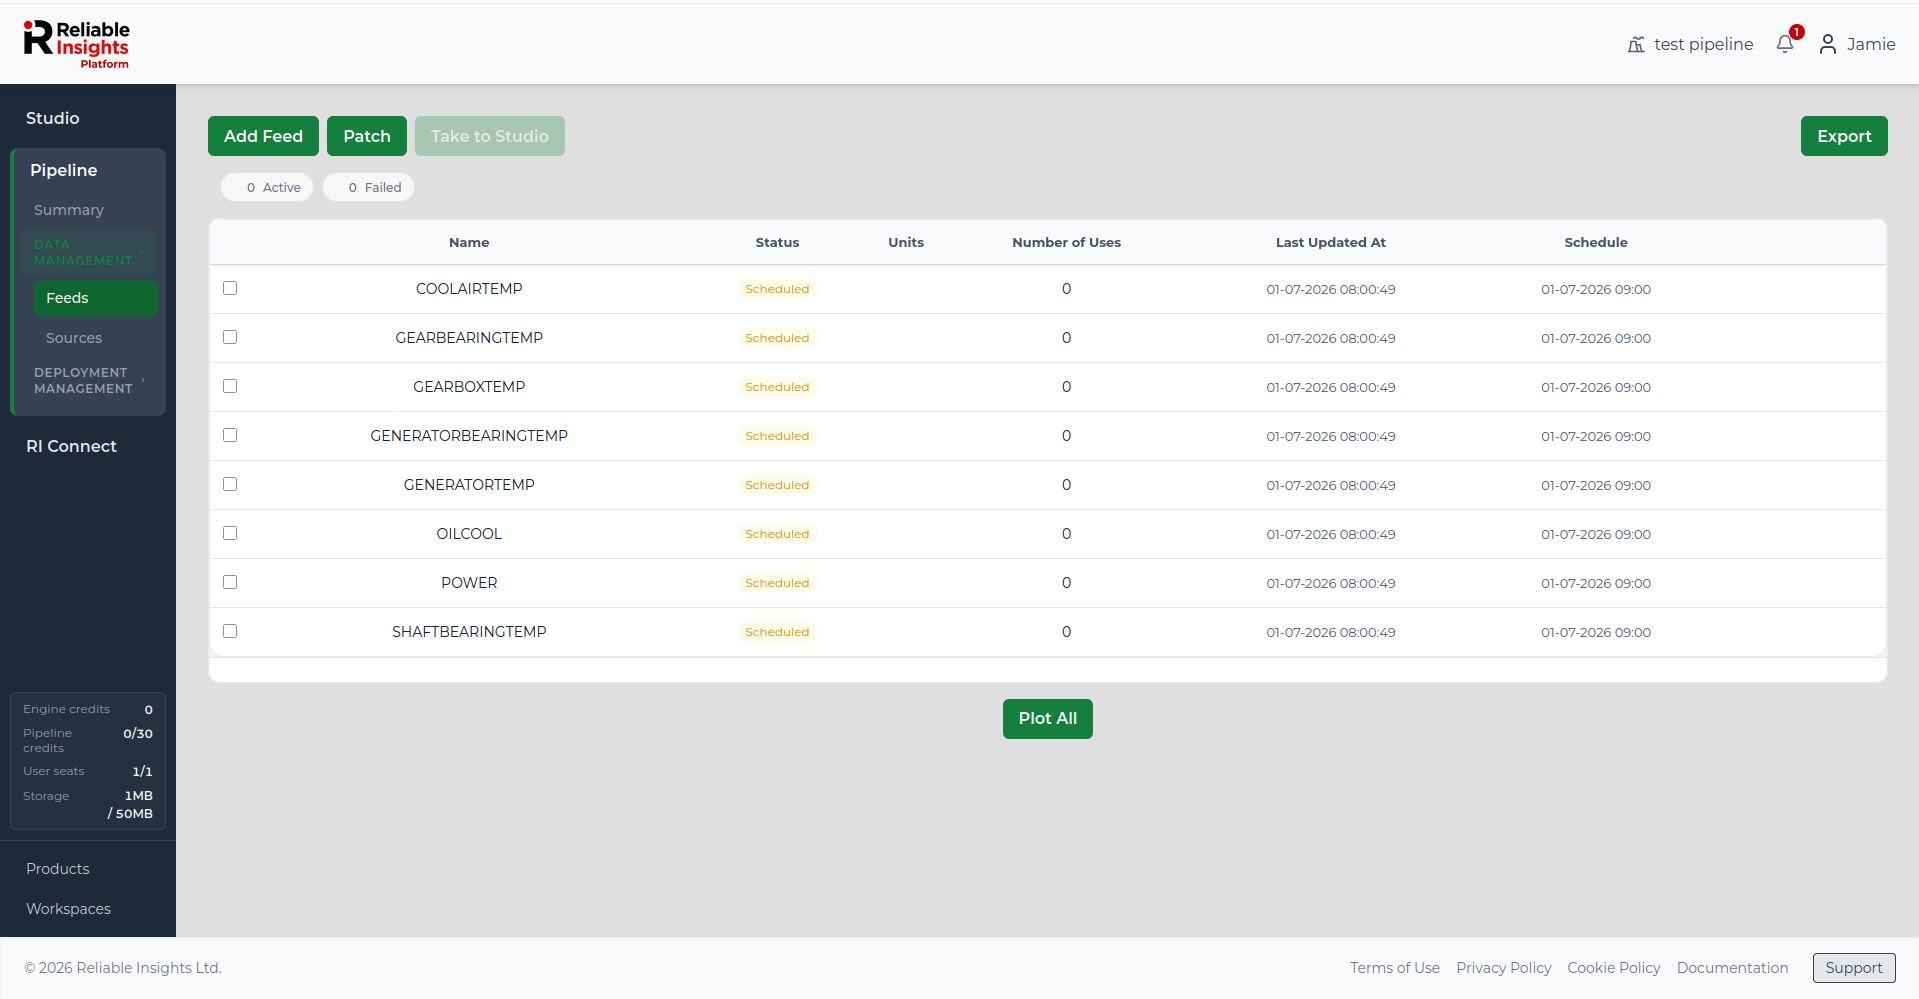
Uploading a patch file
- Go to Feeds in the left sidebar.
- Click Patch.
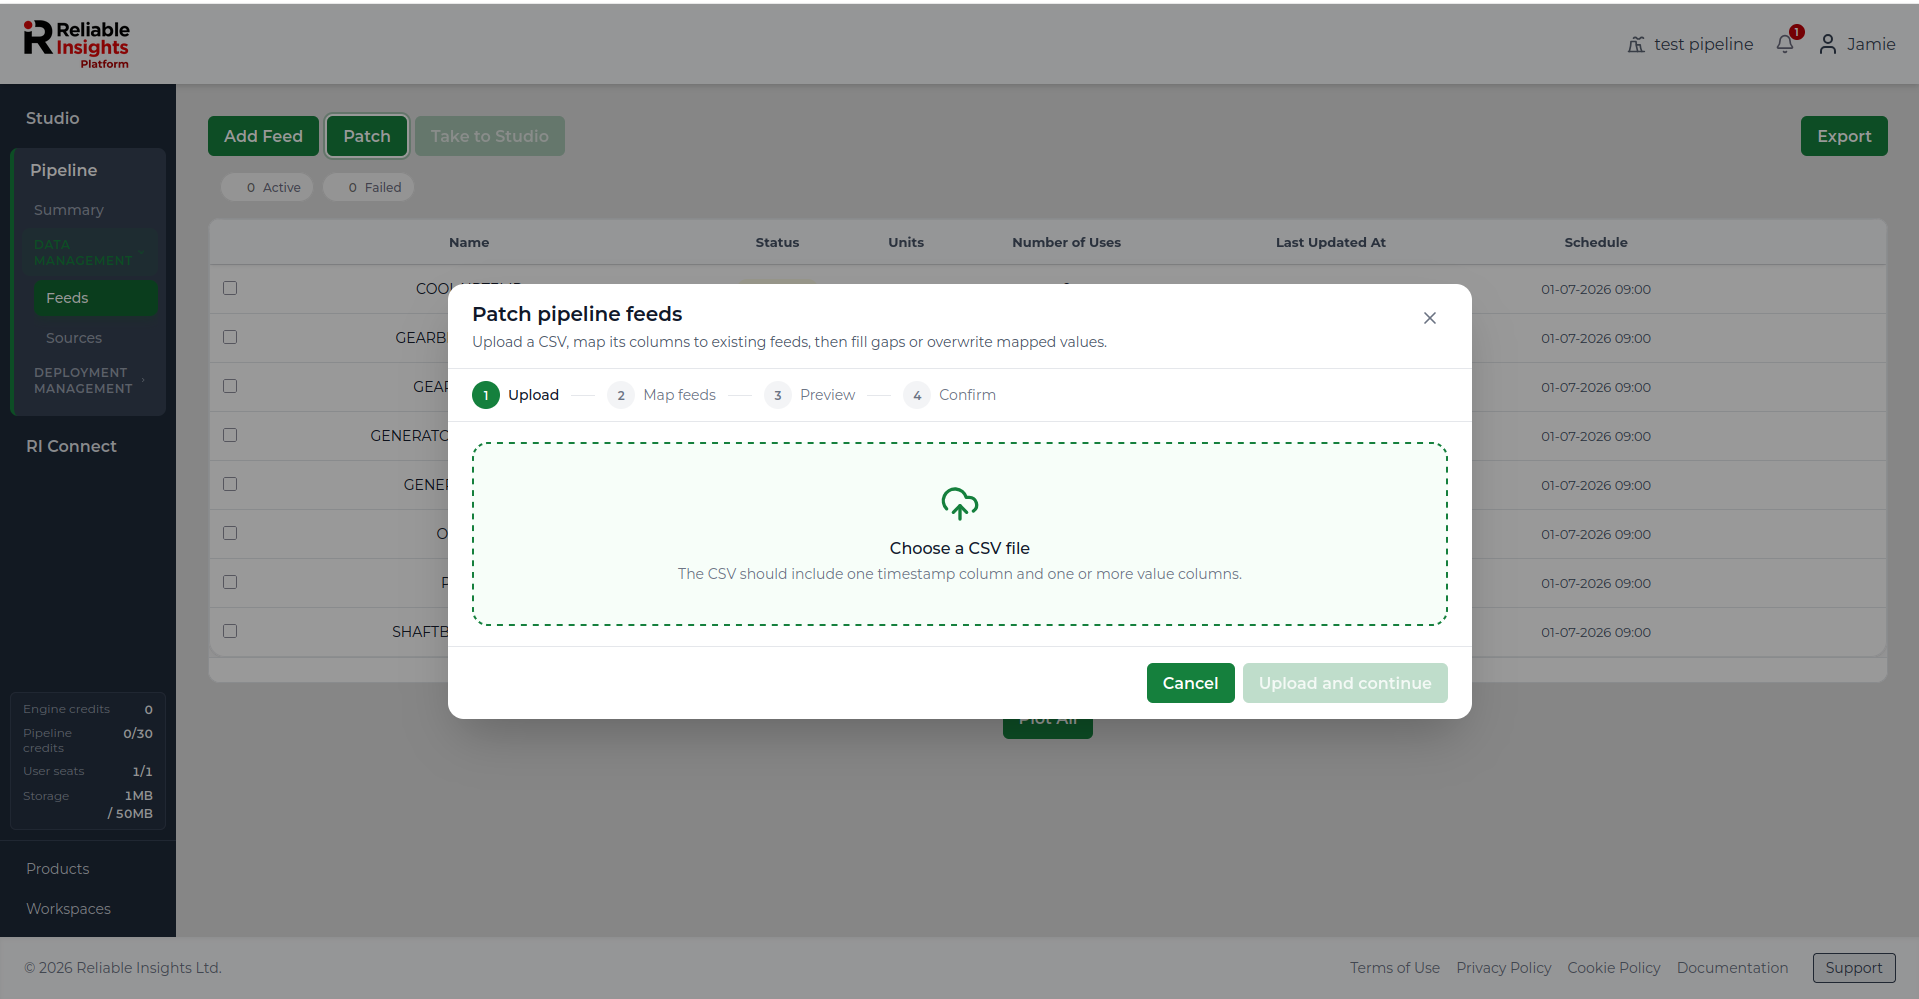
- Upload a CSV file.
The CSV file should include one timestamp column and one or more value columns. The value columns should contain the feed values that you want to add or update.
Mapping CSV columns to feeds
After the file has uploaded, Pipeline asks you to map CSV columns to existing Pipeline feeds.
Pipeline will automatically match columns where the CSV column name matches an existing feed name. You can review and update these mappings before continuing.
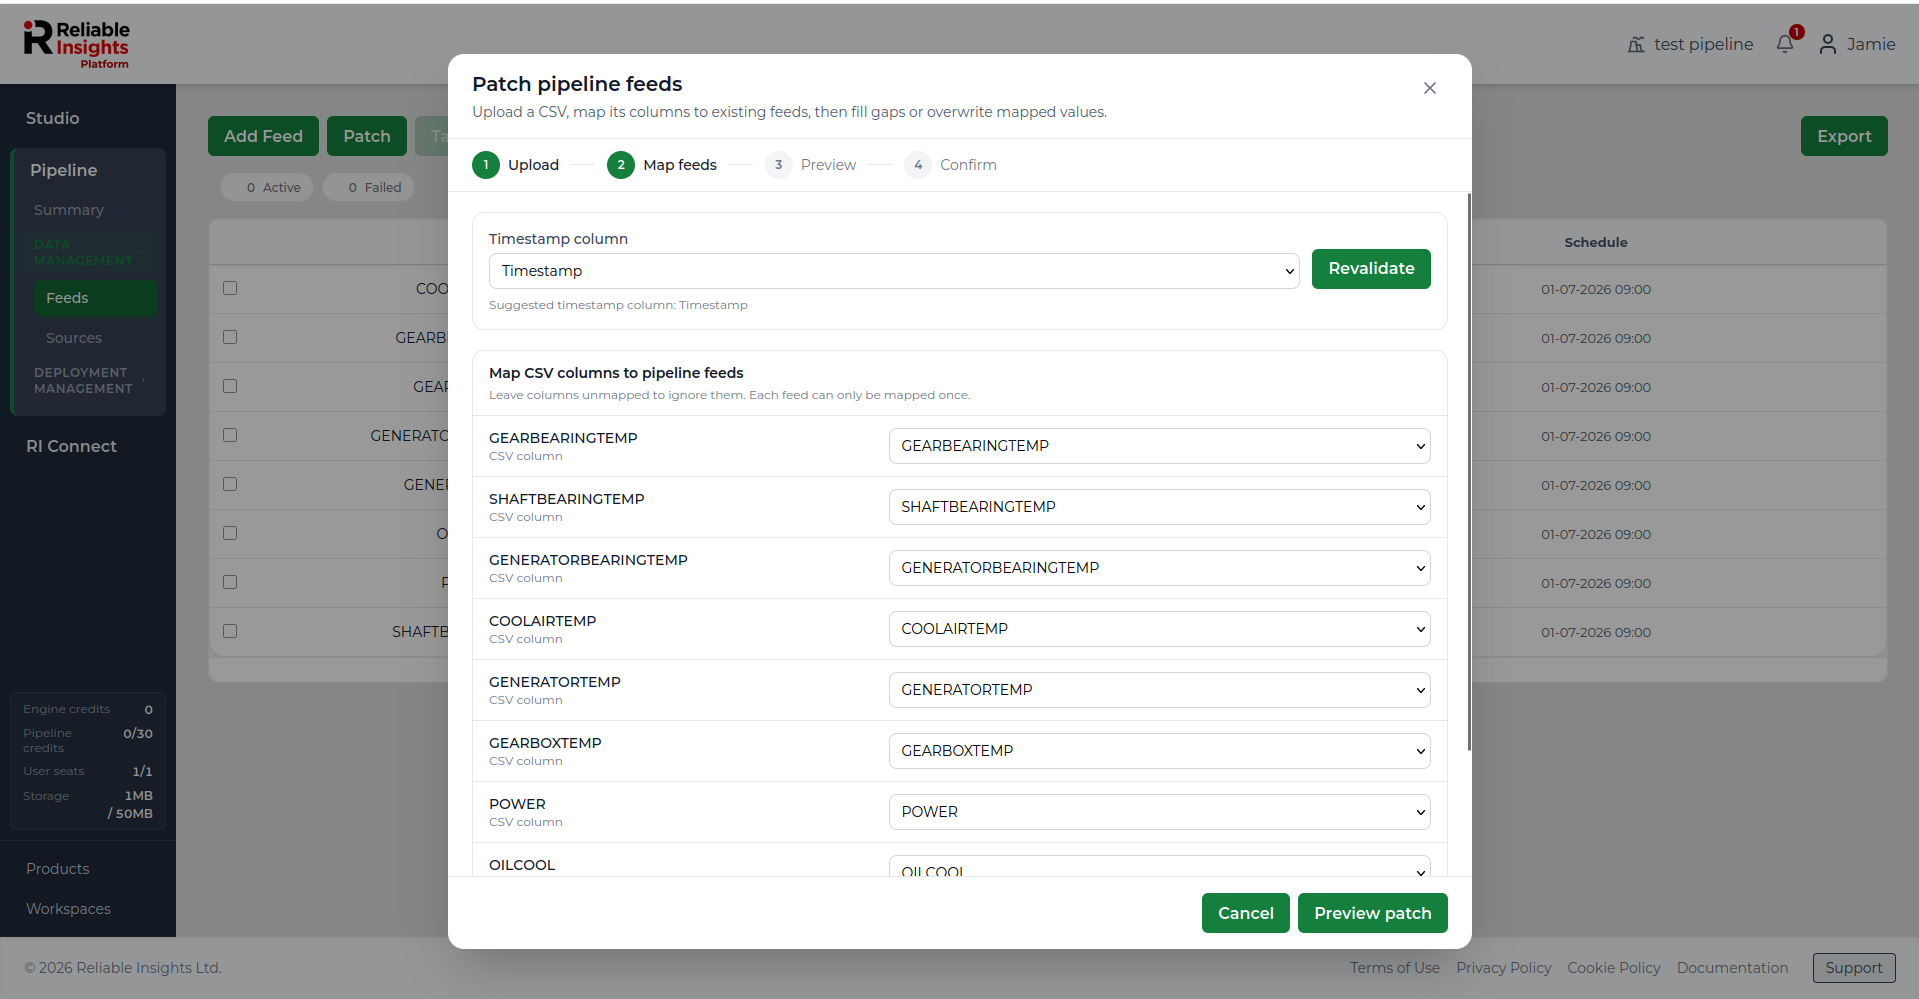
Leave a column unmapped if you do not want to patch it into a feed. Each feed can only be mapped once.
Filling gaps or overwriting values
By default, Pipeline only fills missing values and leaves existing values unchanged. This is useful when you want to backfill gaps without changing data that is already stored.
You can also choose to overwrite existing mapped feed values. When overwrite mode is enabled, values in the CSV can replace existing Pipeline values for the mapped feeds and matching timestamps.
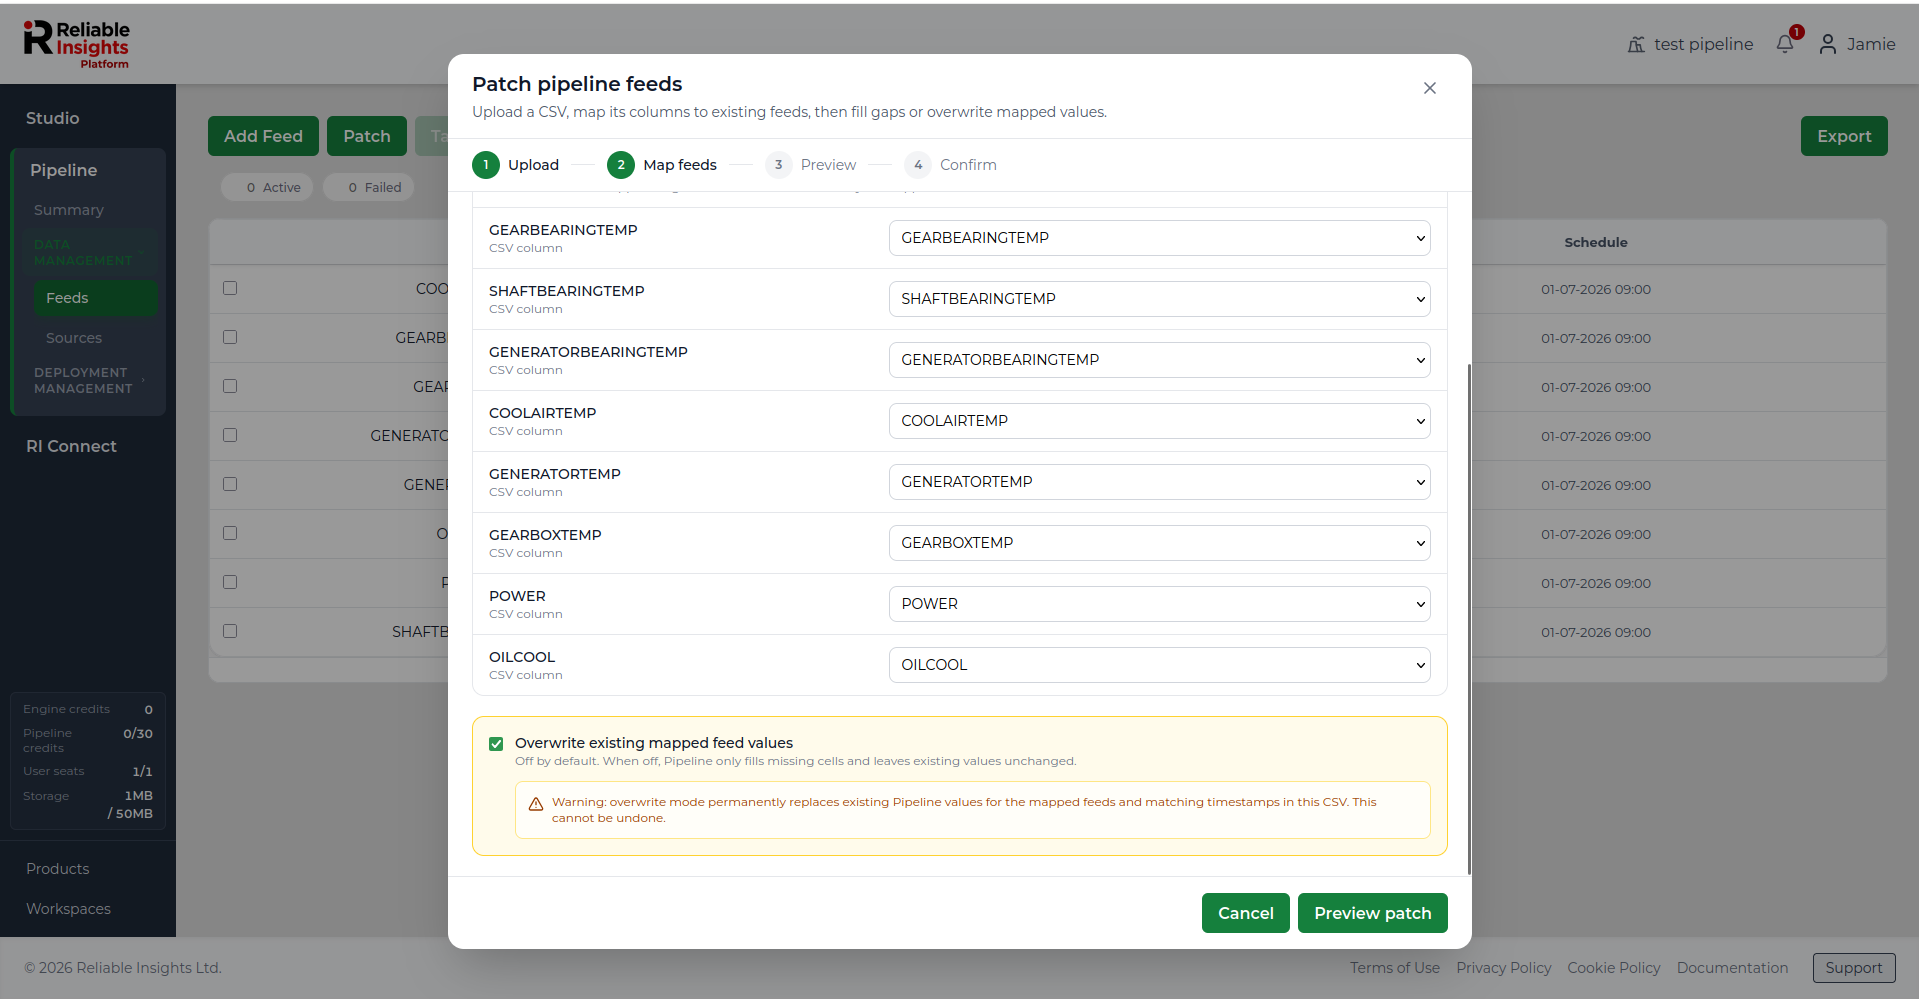
Overwrite mode can permanently replace existing Pipeline values for the mapped feeds and matching timestamps in the CSV file. Review the preview carefully before confirming the patch.
Previewing the patch
Before applying the patch, Pipeline shows a preview summary.
The preview can include information such as:
- Rows read from the CSV file.
- Number of mapped feeds.
- Valid values found.
- Missing values skipped.
- Existing values that will be skipped or overwritten.
- Values that can be inserted.
- Timestamp range covered by the file.
- CSV columns mapped to existing Pipeline feeds.
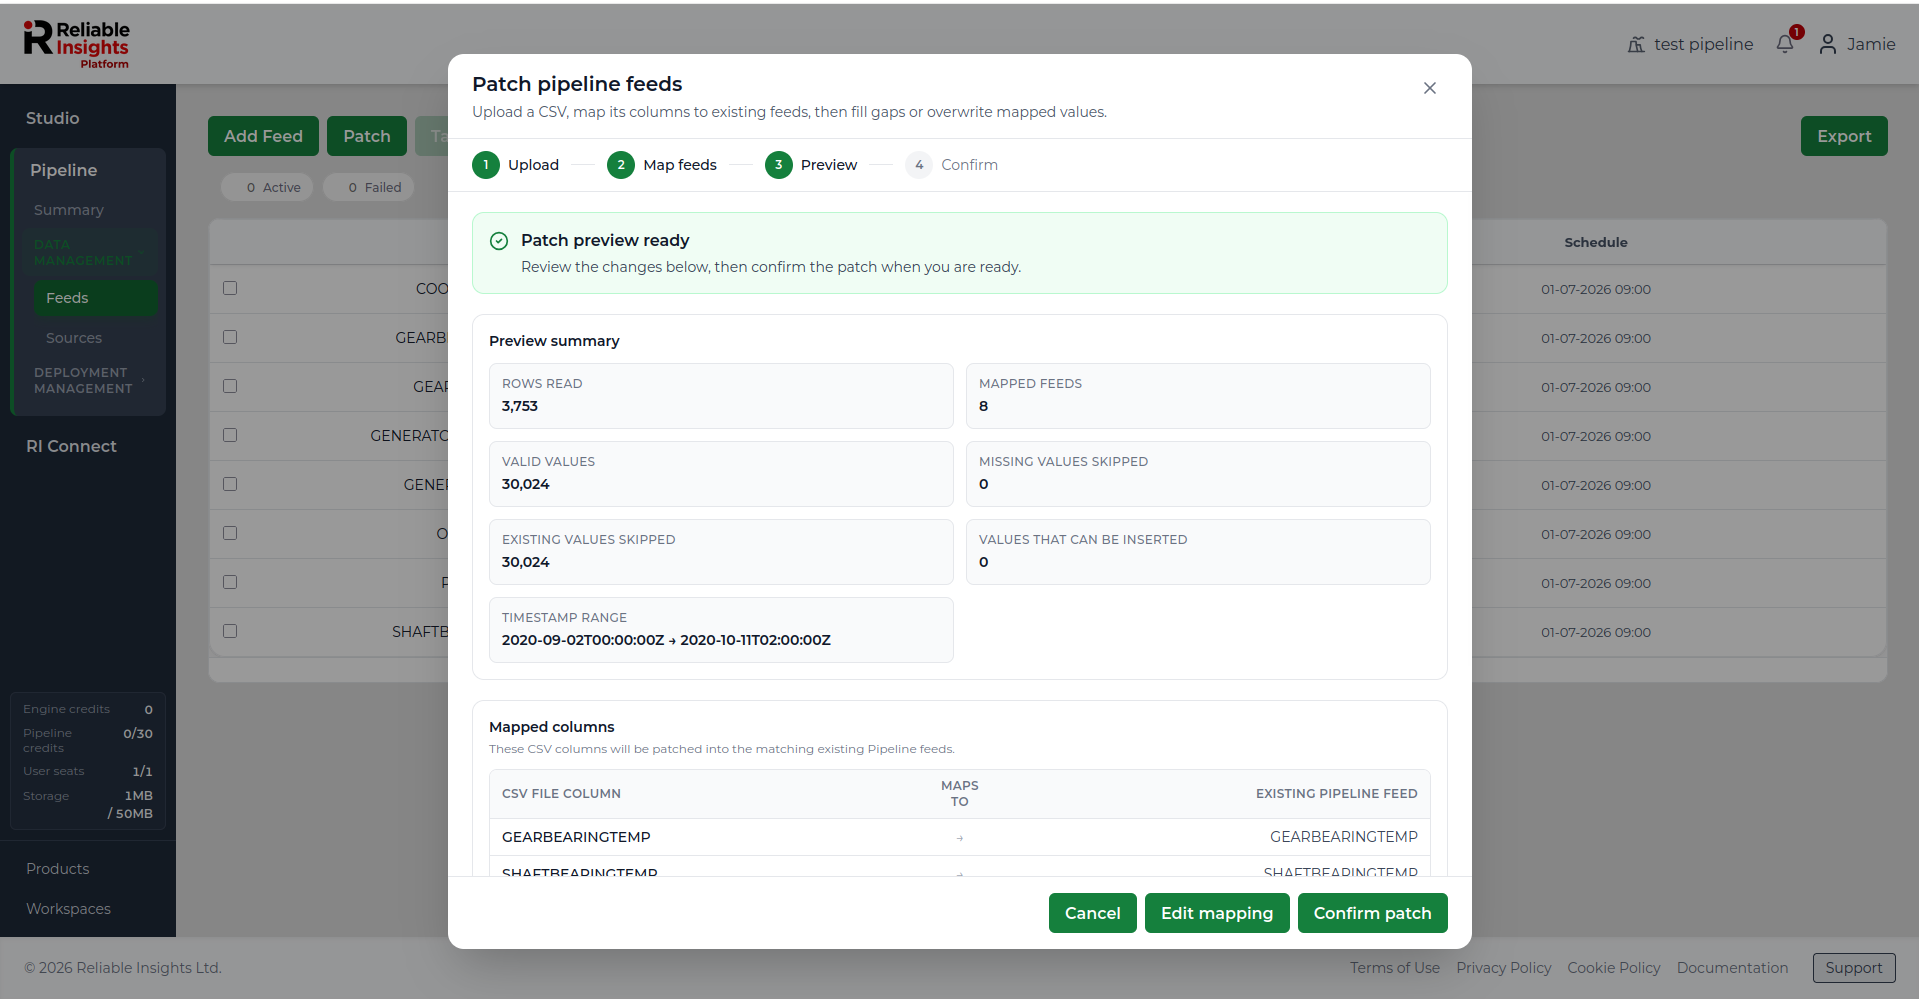
Review the preview before confirming the patch. If the mappings are incorrect, click Edit mapping and update the selected feeds.
Confirming the patch
When you are ready, confirm the patch. Pipeline applies the CSV data to the mapped feeds and shows a completion summary.
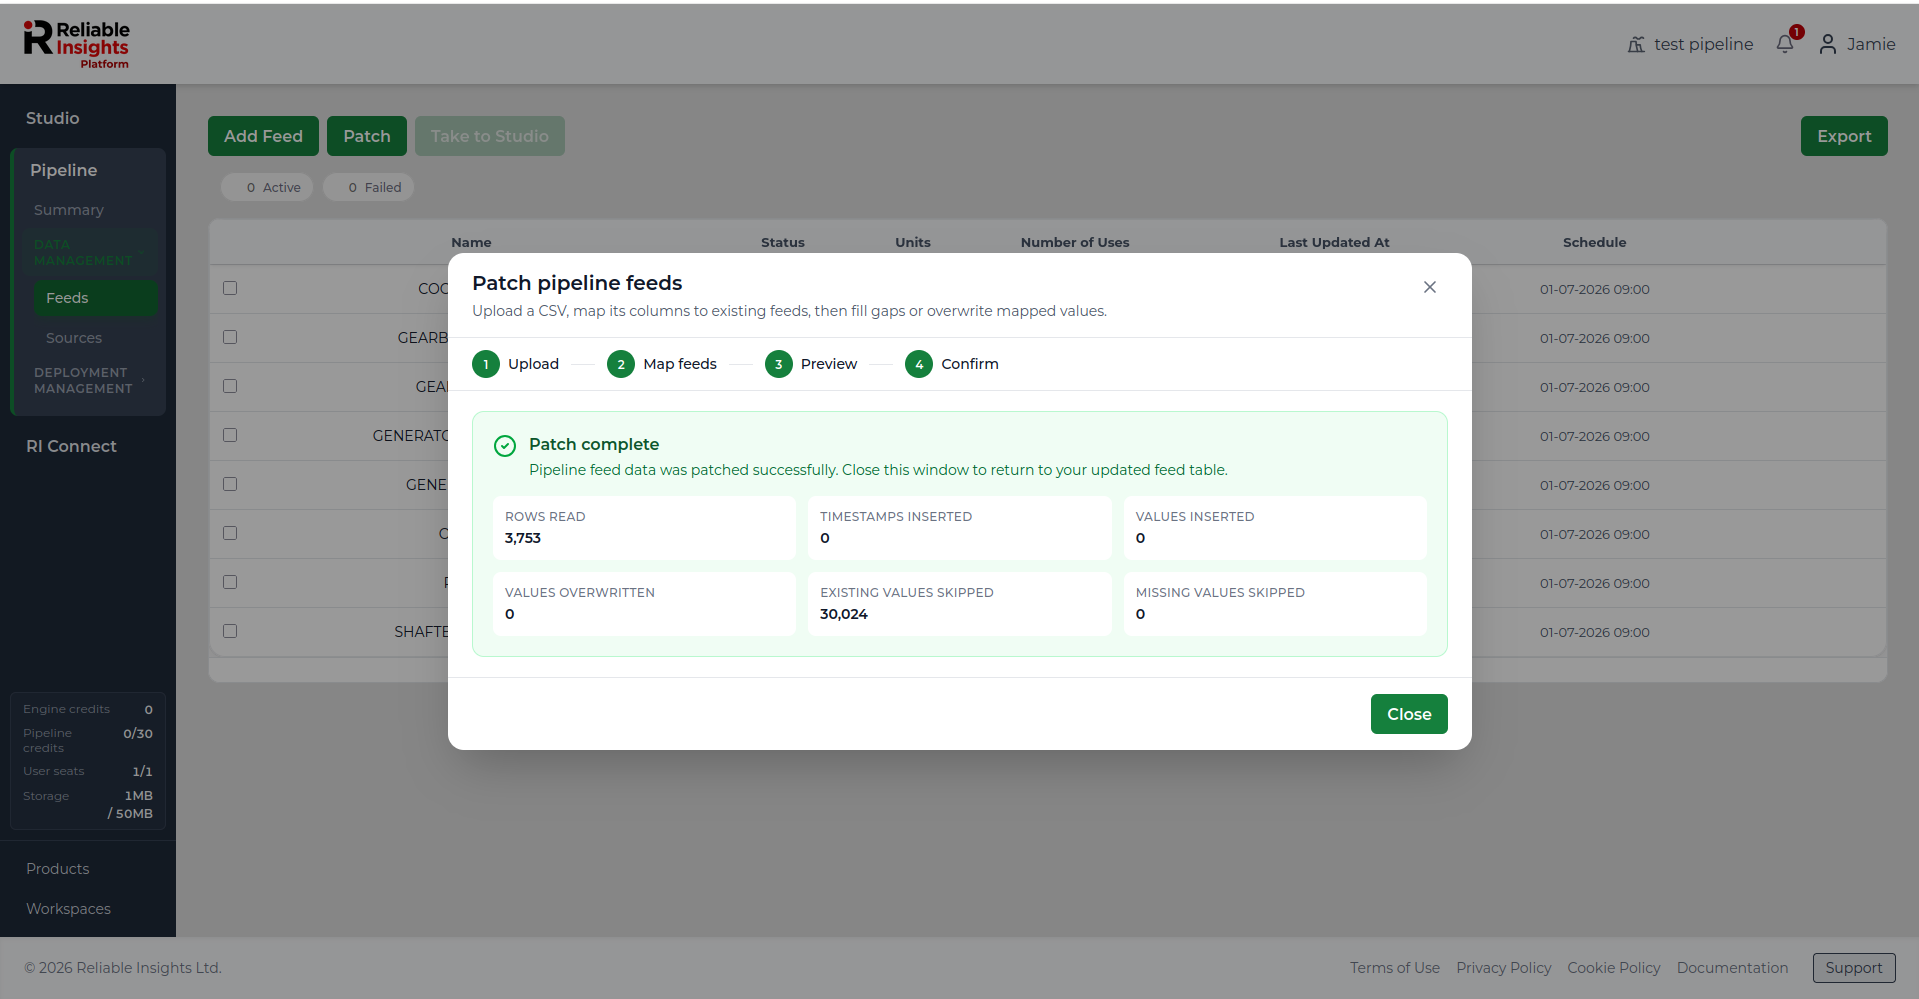
The completion summary shows how many rows were read and how many values were inserted, overwritten, skipped, or ignored. Close the window to return to the updated feeds table.
Patching updates existing feeds. It does not create new feeds. Create the required feeds first, then use Patch to backfill or correct their time-series values.
Plotting all feeds
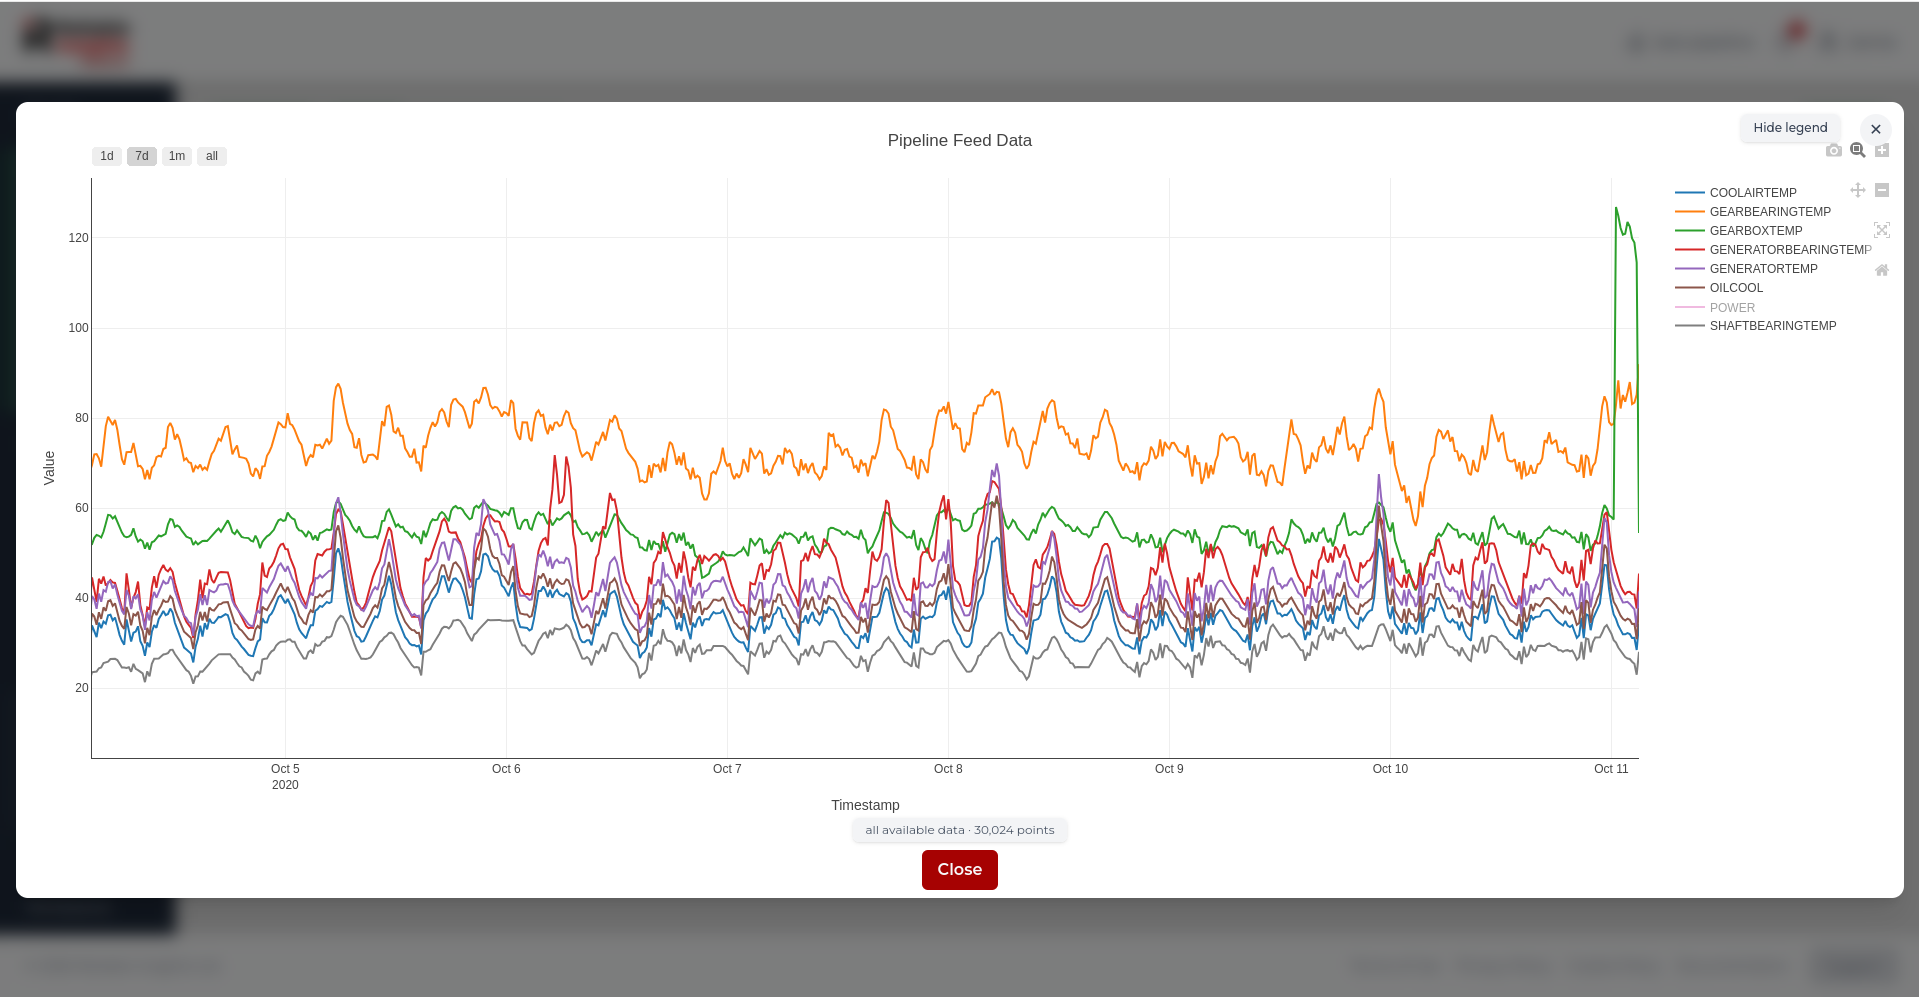
Use Plot All when you want to view all Pipeline feeds together on one time-series plot.
This is useful for quickly checking whether feeds contain data over the expected period, comparing trends across feeds, spotting gaps or unusual values, and reviewing feed behaviour before exporting data or using the feeds in Studio.
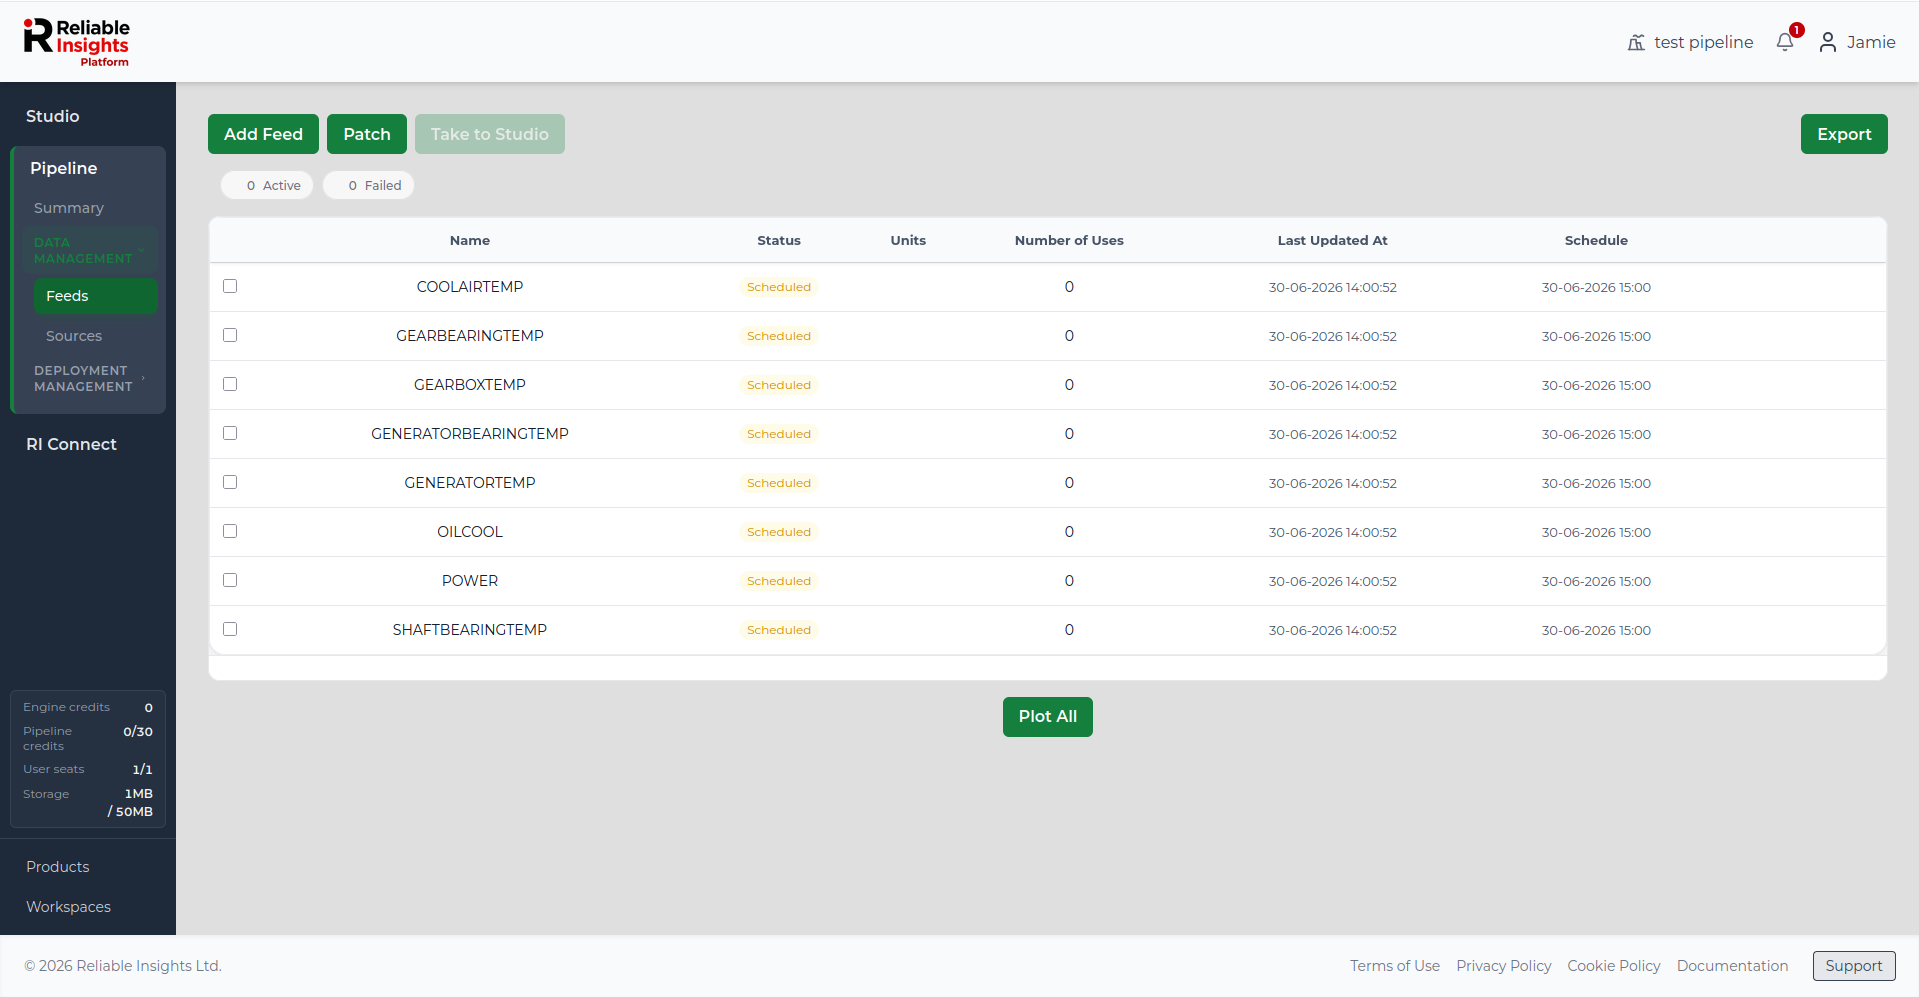
- Go to Feeds in the left sidebar.
- Click Plot All below the feeds table.
- Pipeline opens a combined plot with each available feed shown as a separate line.
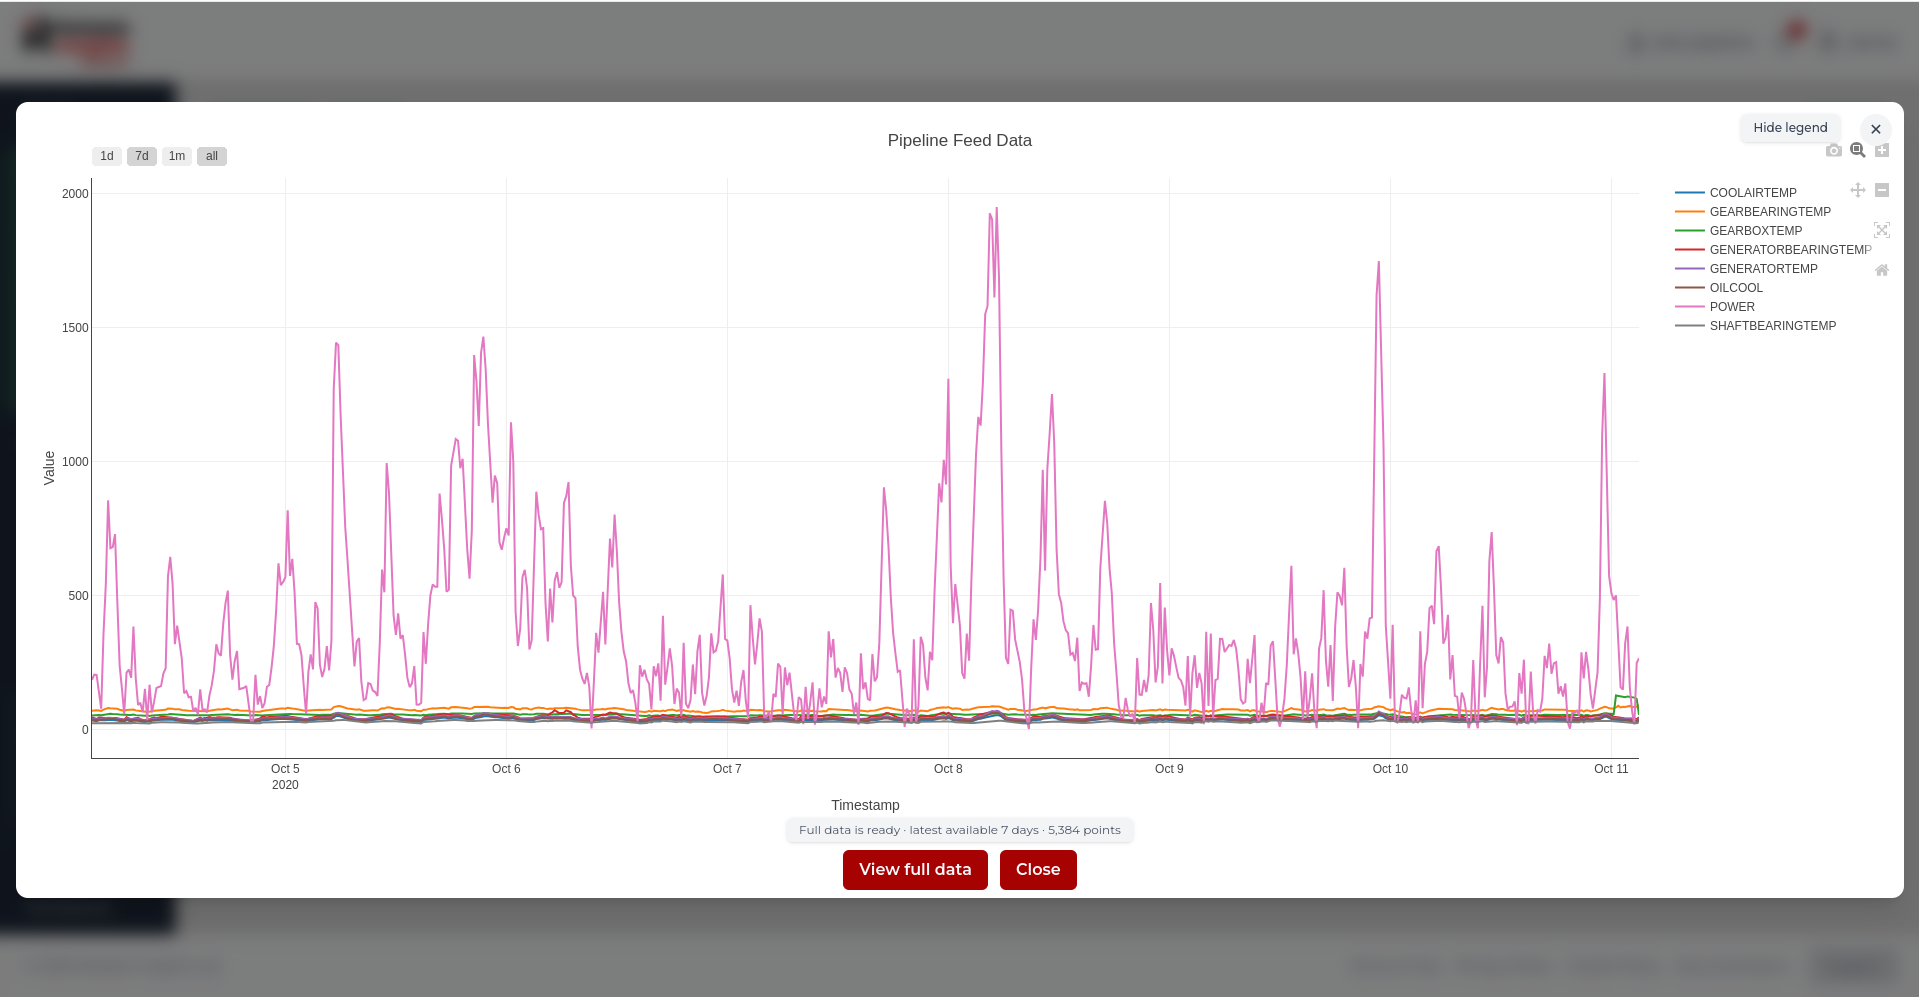
The plot opens with a recent view of the available feed data. This gives you an immediate view of recent feed behaviour.
You can use the plot controls to zoom, pan, reset the view, or inspect specific points. You can also use the legend to show or hide individual feeds if one feed makes the others harder to read.
When the full dataset is ready, click View full data to load all available feed history into the plot.
Exporting feed data
You can export feed data from Pipeline for offline analysis, reporting, or use in other tools.
- Select one or more feeds using the checkboxes. Leave all feeds unchecked if you want to export all available feeds.
- Click Export in the toolbar.
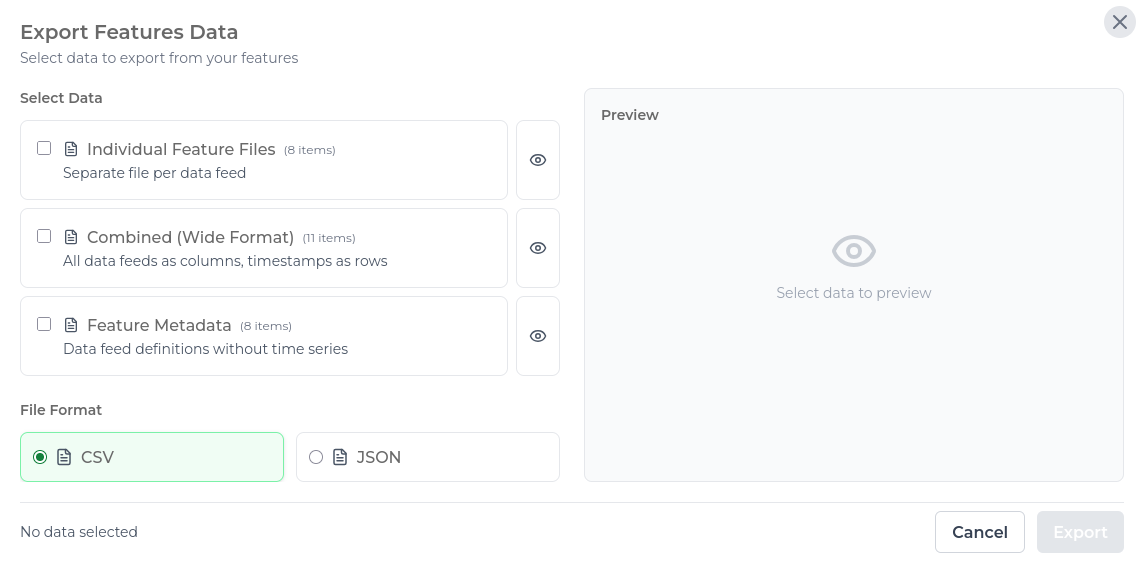
- Choose the data you want to export.
| Option | What it produces |
|---|---|
| Individual Feed Files | One file per feed, with timestamp and value columns. |
| Combined (Wide Format) | One row per timestamp, with each selected feed shown as a separate column. |
| Feed Metadata | A summary file containing feed definitions and metadata, without time-series values. |
- Choose the file format, CSV or JSON.
- Use the preview button to check the export before downloading.
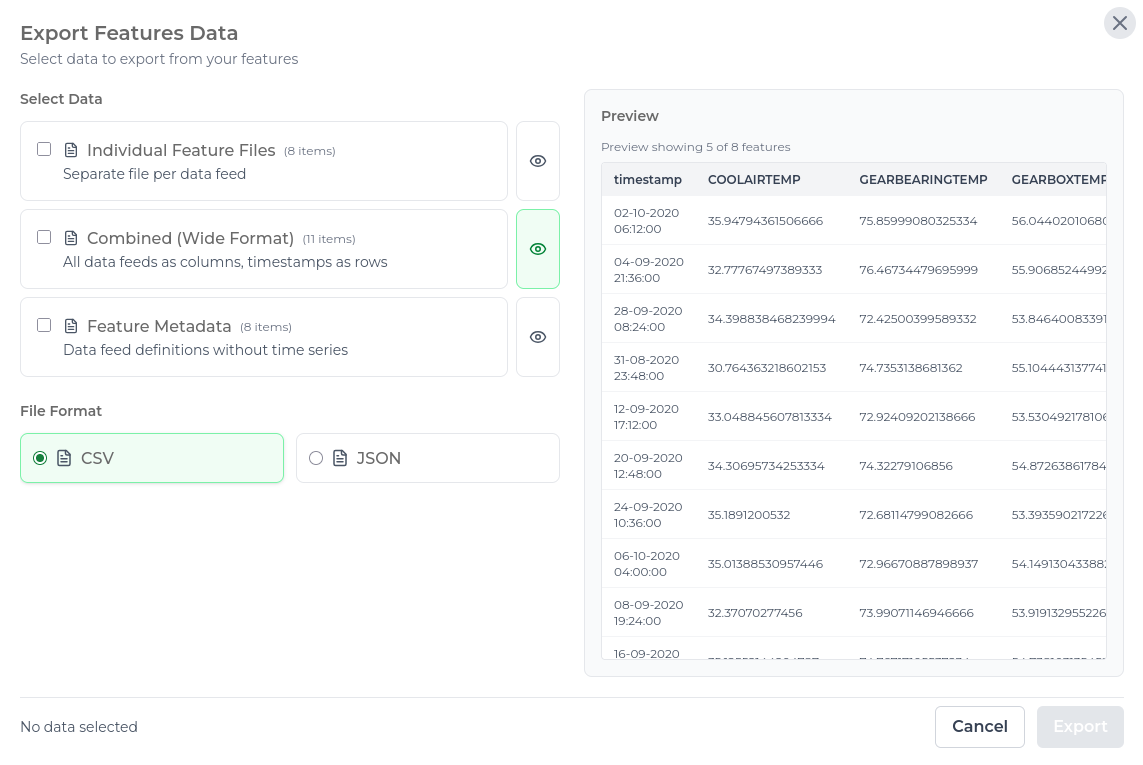
The preview helps you confirm that the selected export contains the expected feeds, timestamps, and values before downloading the file.
- Click Export to download the file.
Take to Studio
Use Take to Studio when you want to create a one-off Studio experiment using selected Pipeline feeds.
- Select the feeds you want to use by ticking the checkboxes on the Feeds page.
- Click Take to Studio in the toolbar.
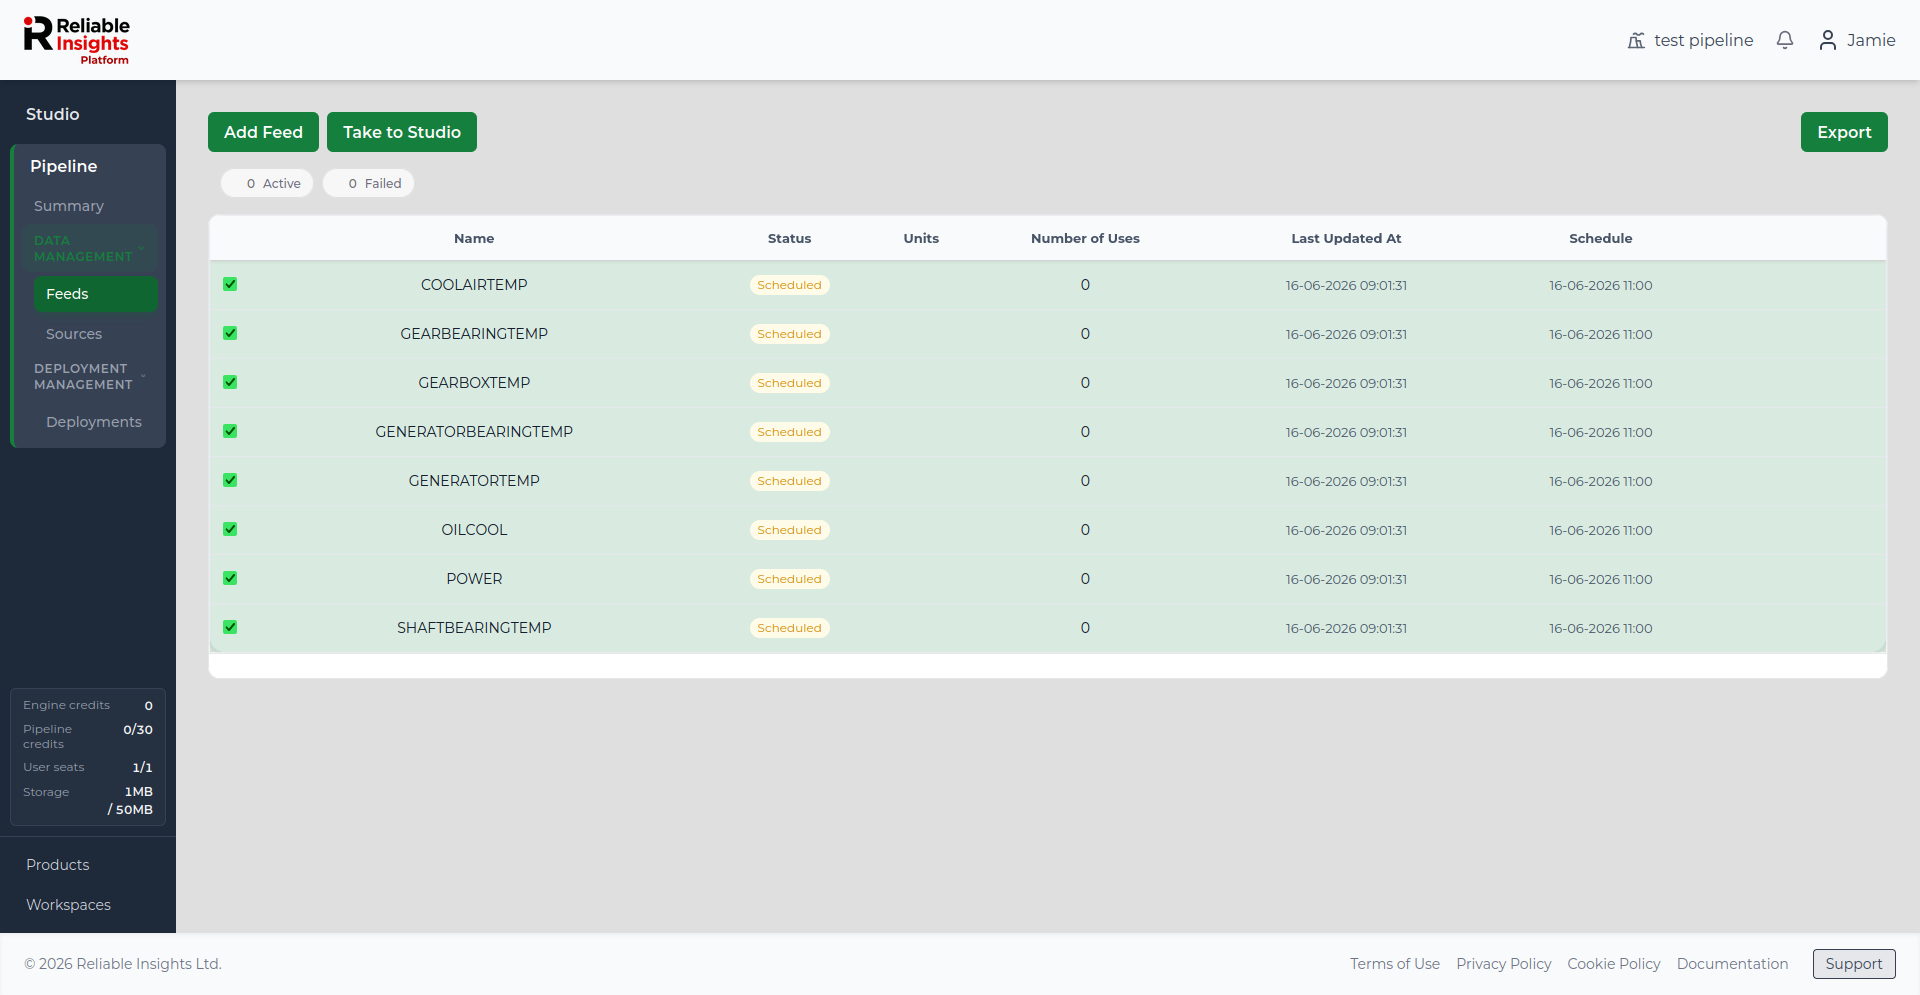
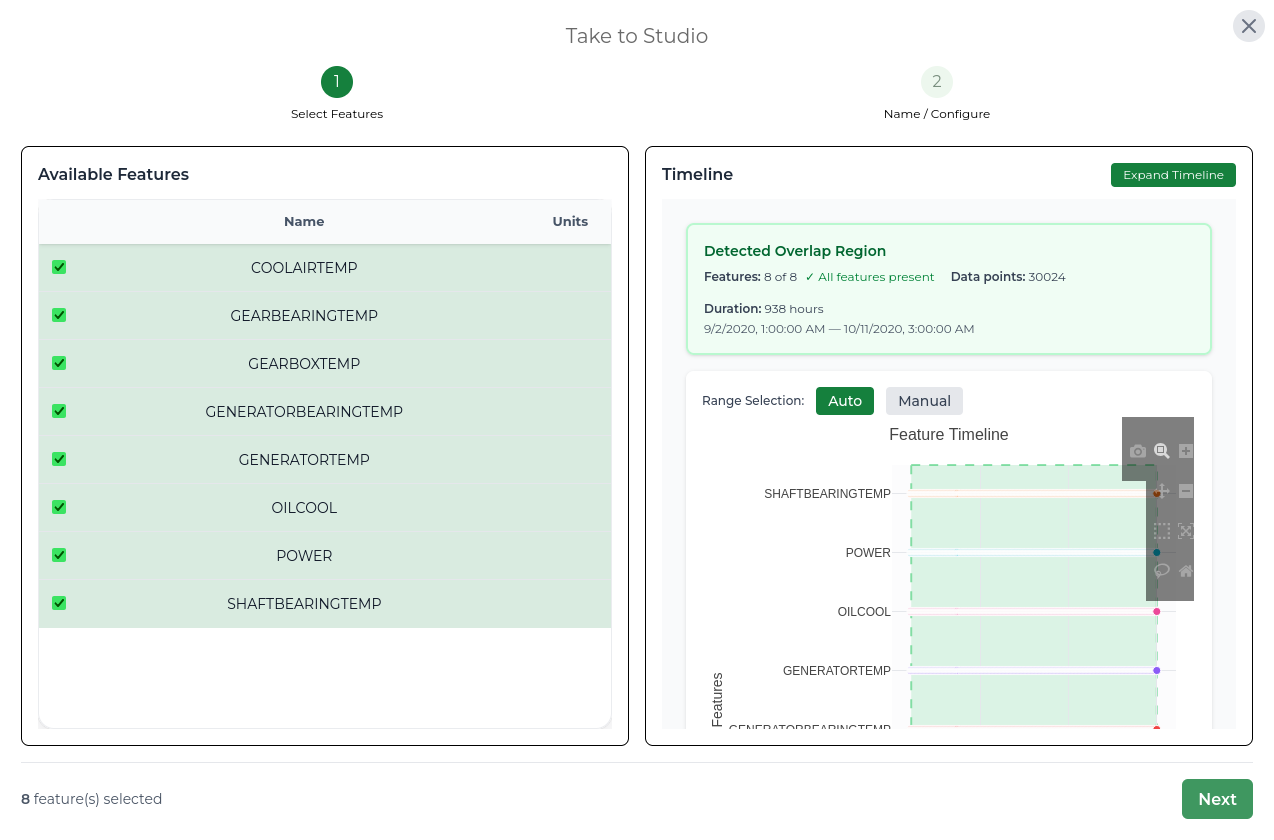
- Step 1 - Select Features: Review the selected feeds. The timeline shows the date range where all selected feeds have overlapping data. Adjust your selection if needed. The overlap range becomes the usable time window for the Studio dataset. If selected feeds only overlap for a short period, the experiment may have too little history to train or validate well, so adjust the feed selection or backfill missing data before continuing.
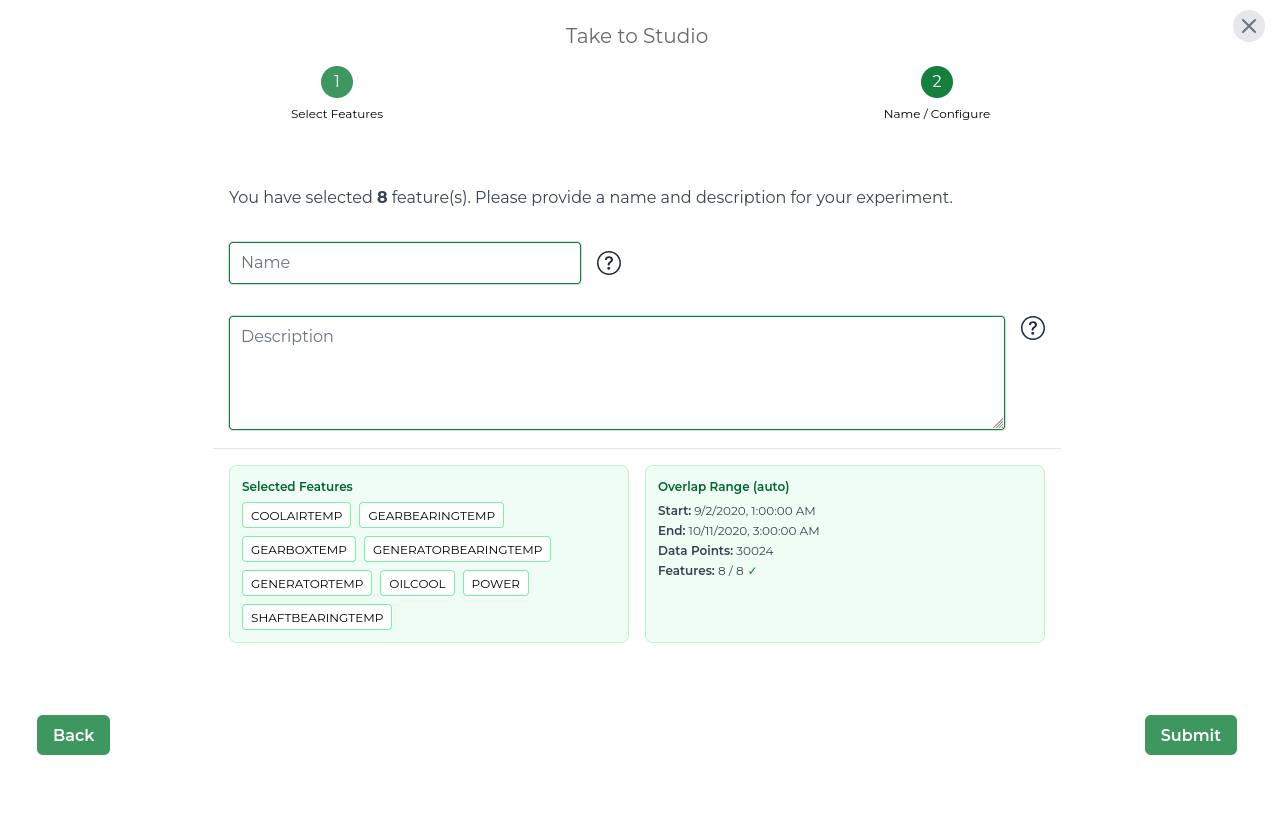
- Step 2 - Name / Configure: Enter a name and optional description for the dataset that will be sent to Studio. Review the selected feeds and overlap range before continuing.
-
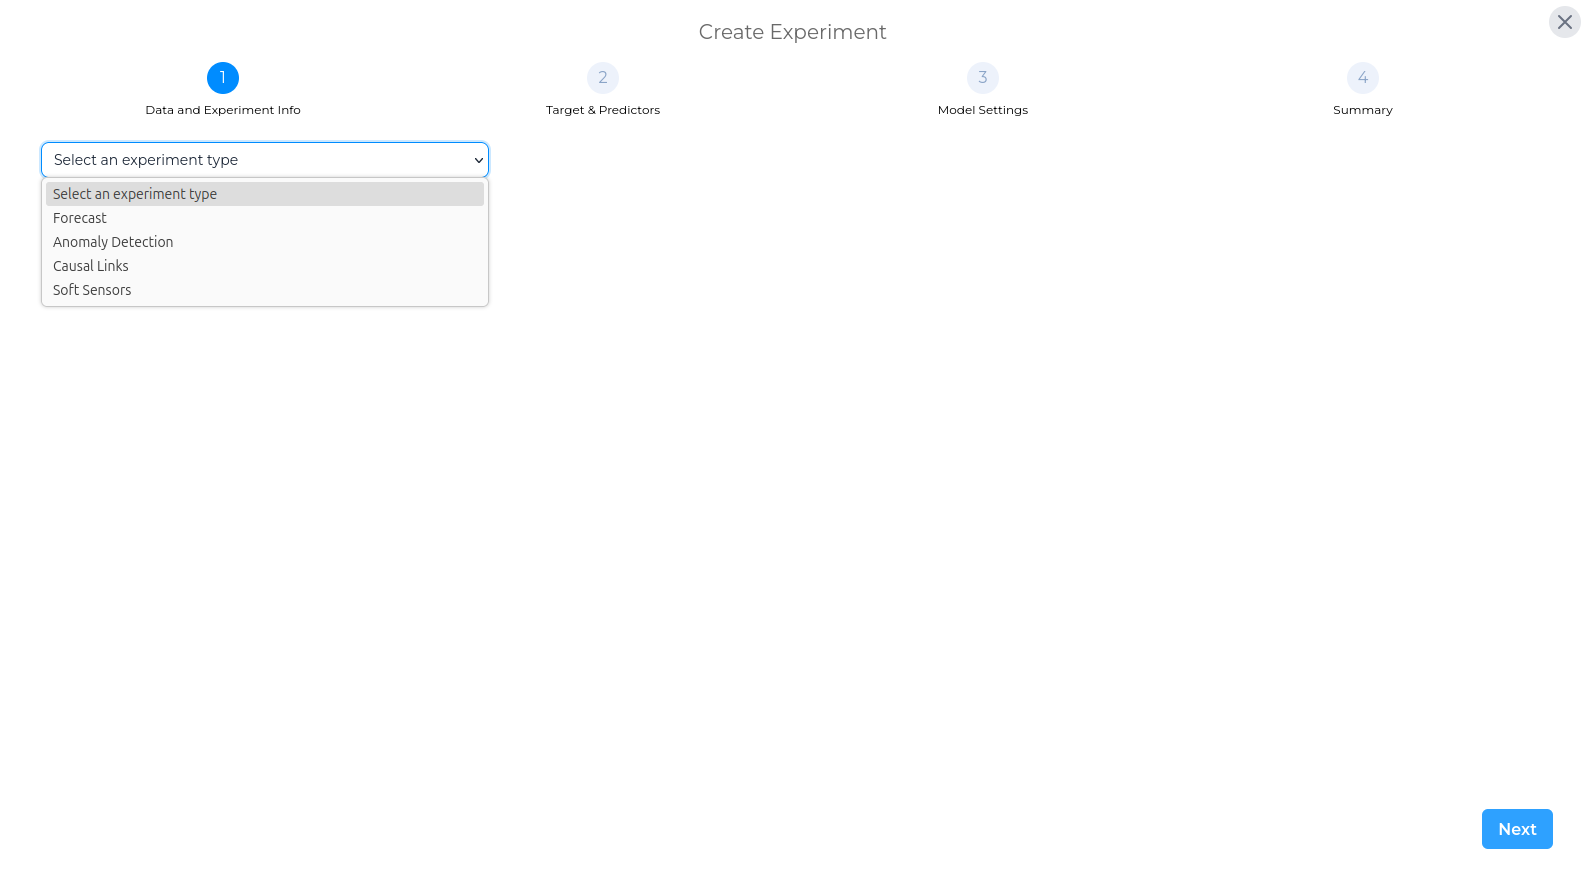
Click Submit. Studio opens the Create Experiment workflow with the selected Pipeline data available as the dataset.
-
In Studio, choose the experiment type and continue configuring the experiment as normal.
Troubleshooting
Pull Failed
- Open the Alerts panel (bell icon in the top bar) and look for a recent alert on this feed.
- The alert message will usually describe the failure (connection refused, authentication error, data format error).
- If the datasource credentials have changed, edit the datasource and update them.
- After resolving the underlying issue, the feed will automatically attempt to pull again at the next scheduled time.
Feed shows Unhealthy
- An unhealthy feed has passed its data pull but the data quality check found problems.
- Common causes: missing values over a long period, sudden gaps in the time series, timestamps in an unexpected format.
- Check the alert for details about what was found.
- You can use Patch to backfill missing values or correct existing feed data from a CSV file.
Patched data shows 0 rows inserted
- Check that the timestamp column name contains the words
timestamp,date,time, ordatetime. - Check that the value column contains only numeric data.
- If the issue persists, try the Preview step again and confirm the columns are correctly mapped.
Scheduled pull is overdue
- If a feed has not pulled in longer than its schedule suggests, check whether the datasource is still reachable by editing it and running a connection test.
- If the datasource test passes but pulls are still not running, contact us via the
Supportbutton.